as you know it's easier for me to make videos than type a bunch of text
*click here* to watch the video
as you know it's easier for me to make videos than type a bunch of text
*click here* to watch the video


remember, the BPT Breadth Thrust indicator what is oversold last Wednesday. Currently the S&P 500 is finding logical resistance at the middle Bollinger Band, which is the same as the 20 day moving average


You can view the Newsletter here
hello
everyone and happy Fathers day, here's the weekend commodity
newsletter, this one is a bit longer than normal as I discuss quite a
bit Administration comments.
Hello all dedicated readers of my blog, apologize for my lack of posts for the last few days, however I recently broke my left wrist quite severely, and just had major surgery. As you can imagine I have taken a break from the computer and it is also extremely difficult to type. However please stay tuned and keep my blog bookmarked
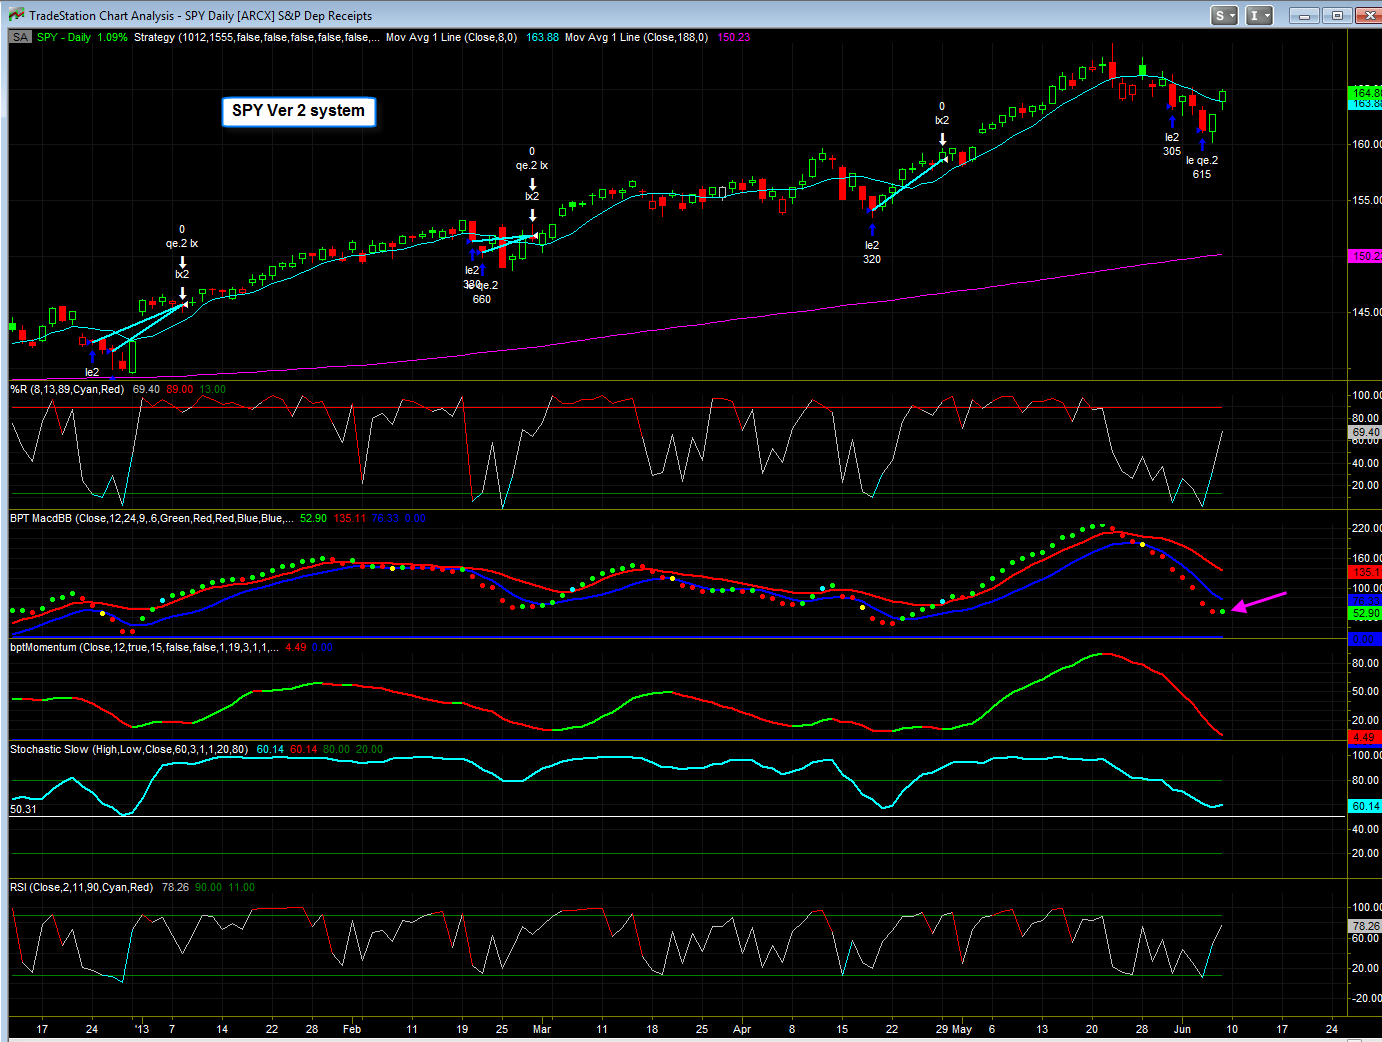
as a follow up confirmation The SPY Pro and SPY Ver2 systems both exited there long positions today at the market open and the trade station systems section has now been updated to reflect this


Great day for the mechanical systems, the SPY RSI 2, SPY VER 2, and SPY Pro systems, even the XLE system.
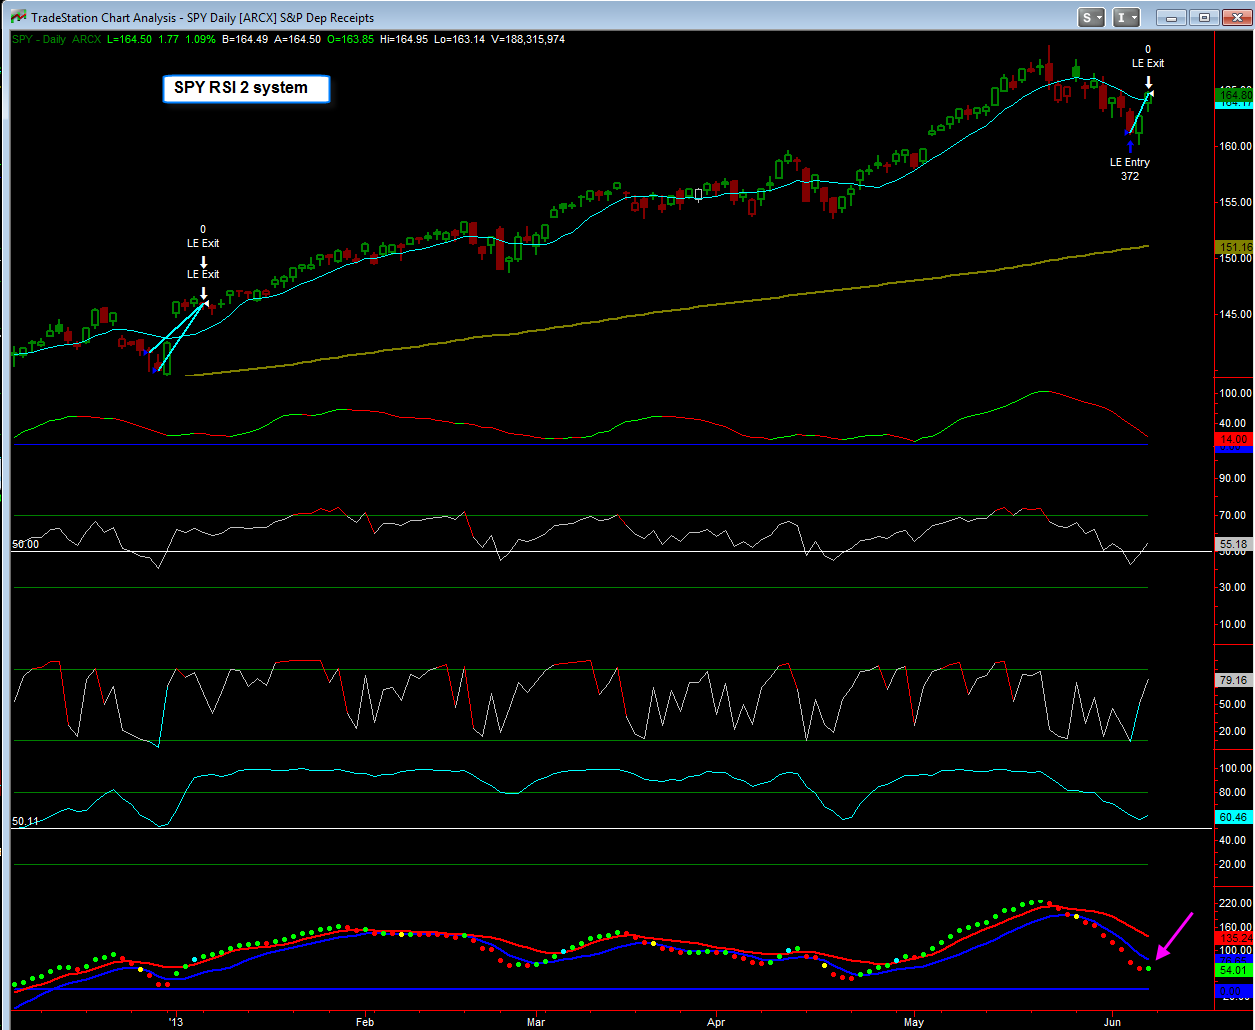
Remember, the SPY RSI 2 system excited today at the close, I have updated the website statistics to reflect this. The SPY VER 2, and SPY Pro systems systems will exit on Monday morning.
**CLICK HERE** to watch the video
Matthew Frailey

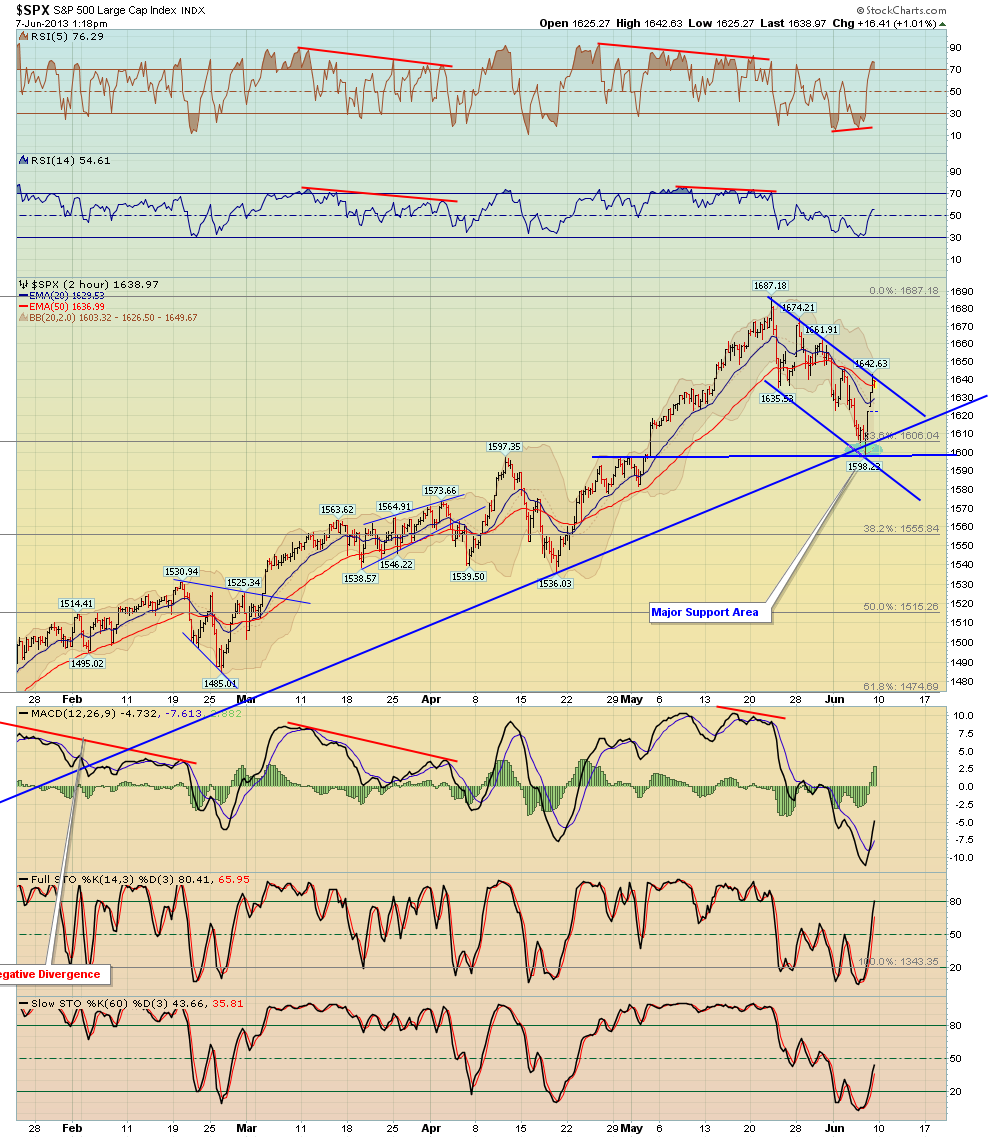
$SPX - Chart Link - as you can see perfect rally off the uptrend line that we showed before
$SPX - Chart Link - 2 hour chart showing the same uptrend line
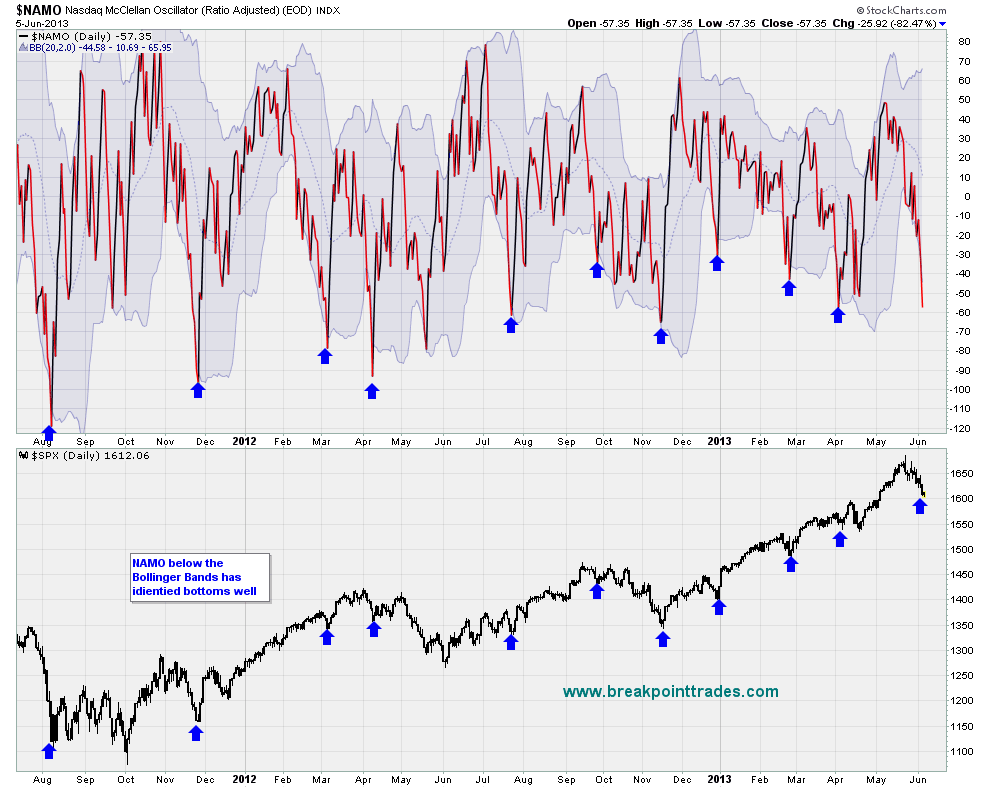
$NAMO - Chart Link - our custom NAMO indicator worked again beautifully, which as you can see gave a buy signal on Wednesday



Hello everyone, as you know the market had a large move today to the downside and has had a nice correctly the last couple weeks - here's our in-depth technical analysis on the market in newsletter form
**CLICK HERE**To View the Newsletter
Best to your week, Matthew Frailey
Hello everyone, as you know the market had a very strong pullback today, can't say we were surprised. The S&P 500 lost 22 1/2 points while the Dow Jones lost 217 points.
Here's a few charts that we are following:
The first chart shows a daily S&P 500 chart, as you can see the uptrend line from the November lows is fast approaching, should it fail to hold, the next major support areas are shown in green.
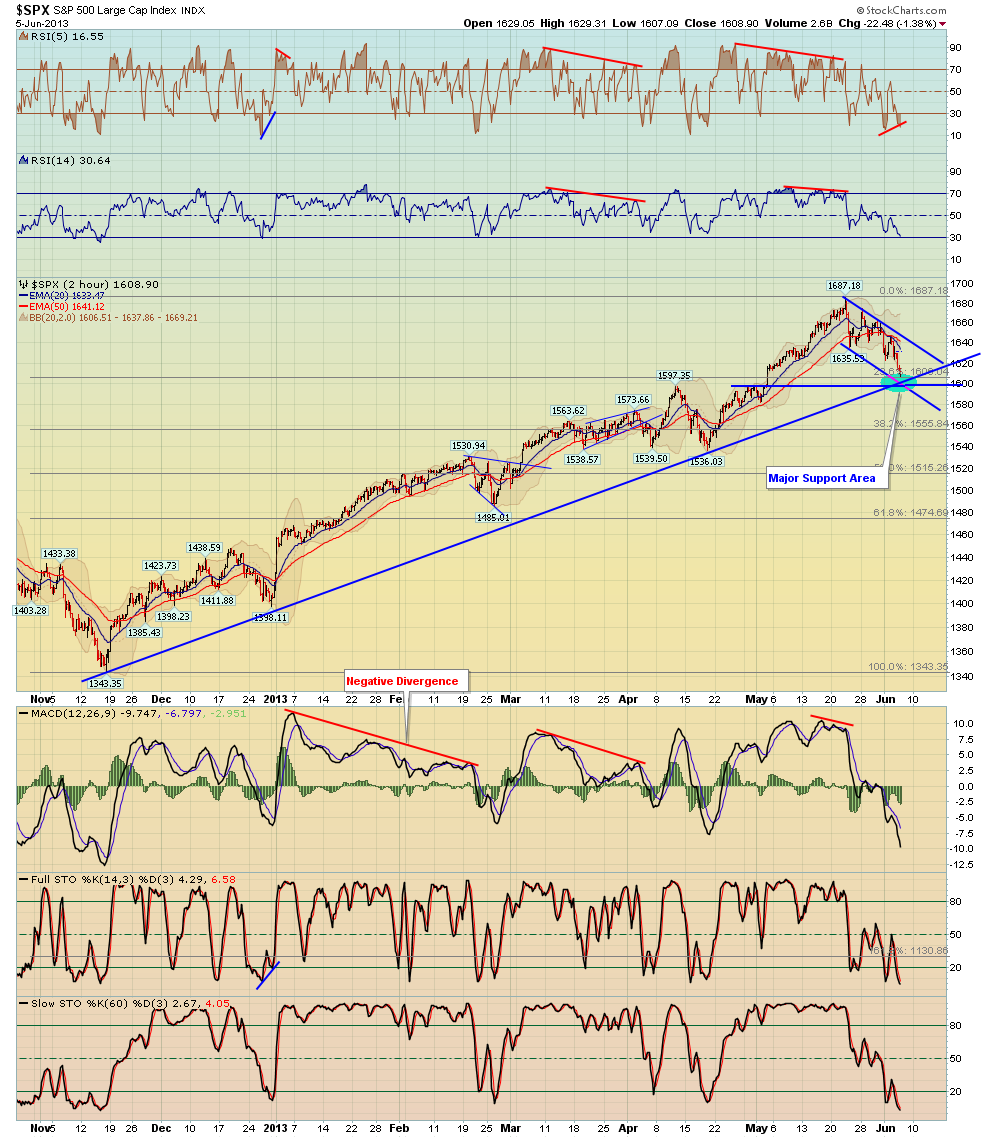
The second chart shows a 2 hr chart of the S&P for a closer view
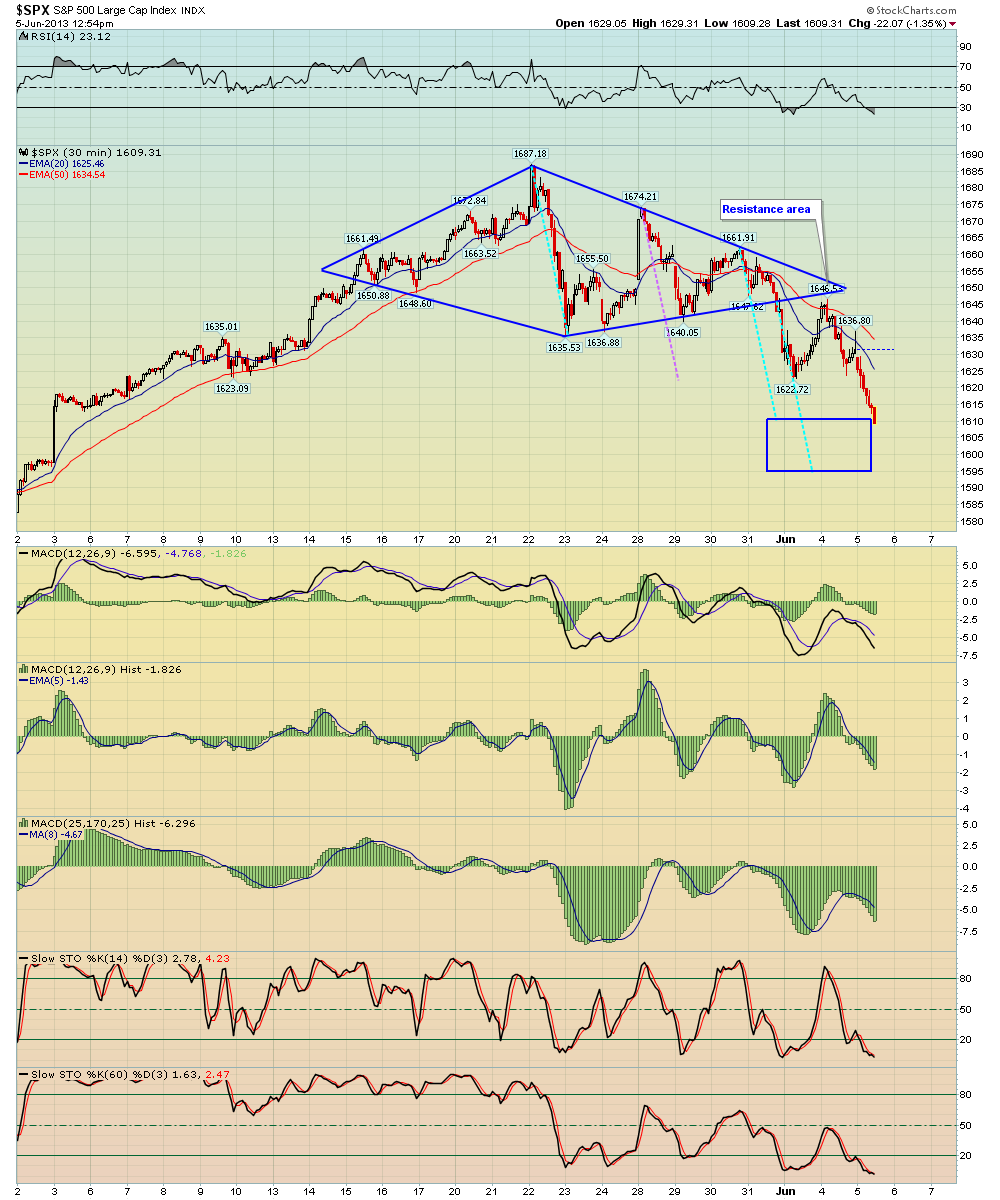
The third chart shows a 30 min Diamond pattern, which is now into it's projected target zone.
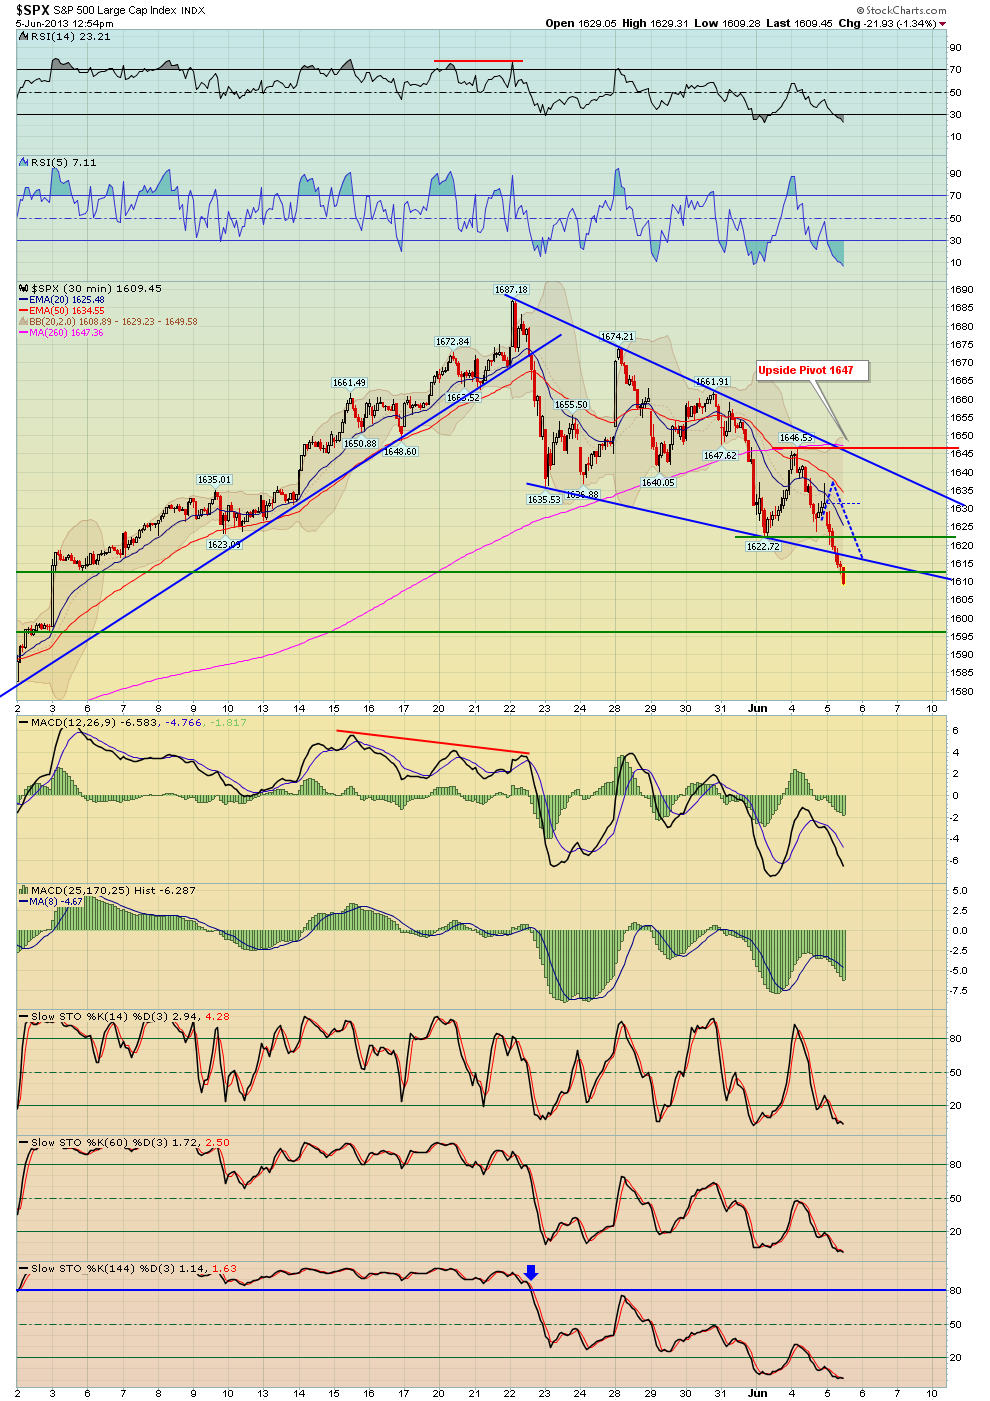
The last chart shows another 30 min chart of the S&P with our favored Elliot Wave count structure on the chart - if this is the correct count, then a bounce from here would only represent a 4th wave bounce which still needs another decline in wave 5 to complete.



 I will remain cautious until evidence changes. Not looking to pick exact bottoms for swings. With that said, the indexes are quite oversold and thus one must be prepared for a bounce attempt.