Hello everyone, as you know the market had a very strong pullback today, can't say we were surprised. The S&P 500 lost 22 1/2 points while the Dow Jones lost 217 points.
Here's a few charts that we are following:
The first chart shows a daily S&P 500 chart, as you can see the uptrend line from the November lows is fast approaching, should it fail to hold, the next major support areas are shown in green.
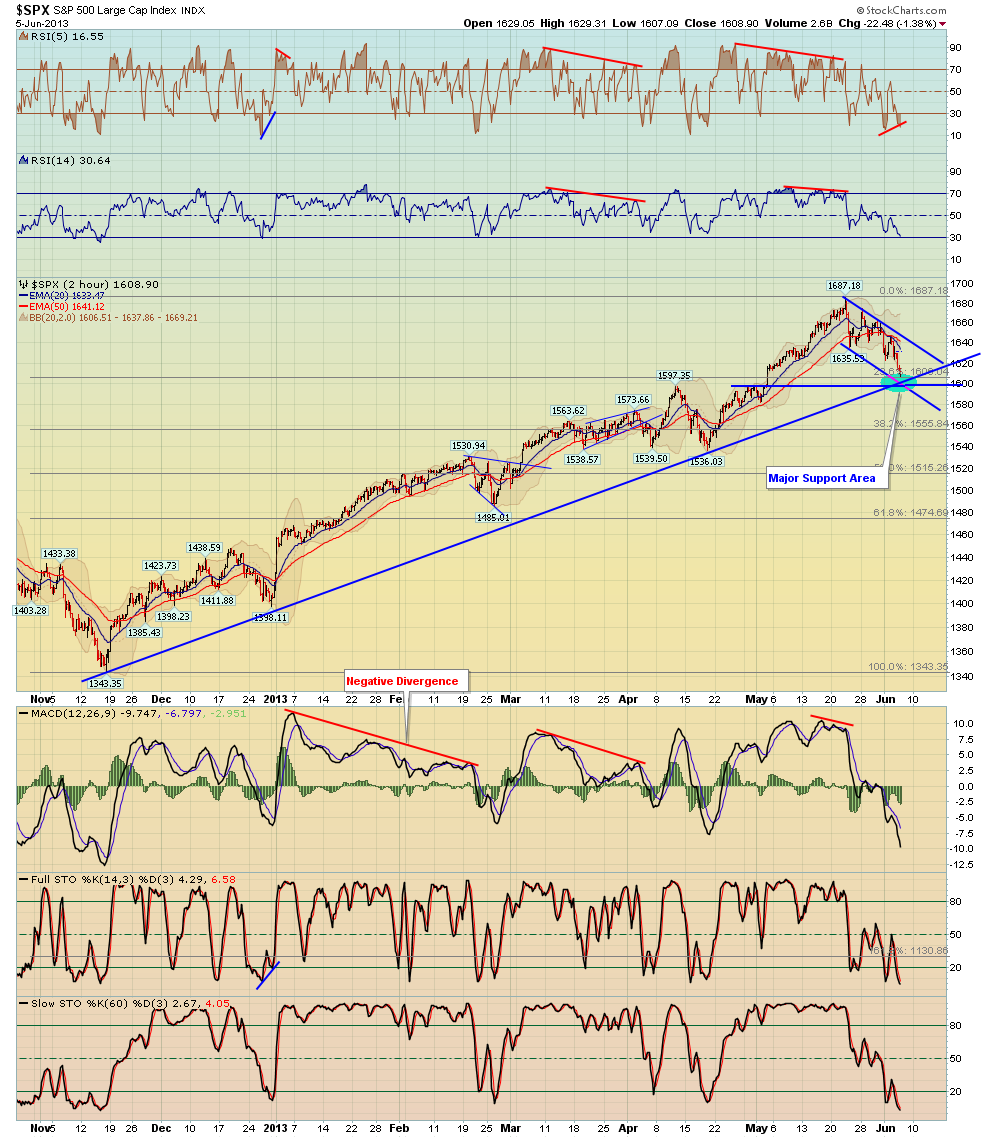
The second chart shows a 2 hr chart of the S&P for a closer view
The third chart shows a 30 min Diamond pattern, which is now into it's projected target zone.
The last chart shows another 30 min chart of the S&P with our favored Elliot Wave count structure on the chart - if this is the correct count, then a bounce from here would only represent a 4th wave bounce which still needs another decline in wave 5 to complete.


No comments:
Post a Comment