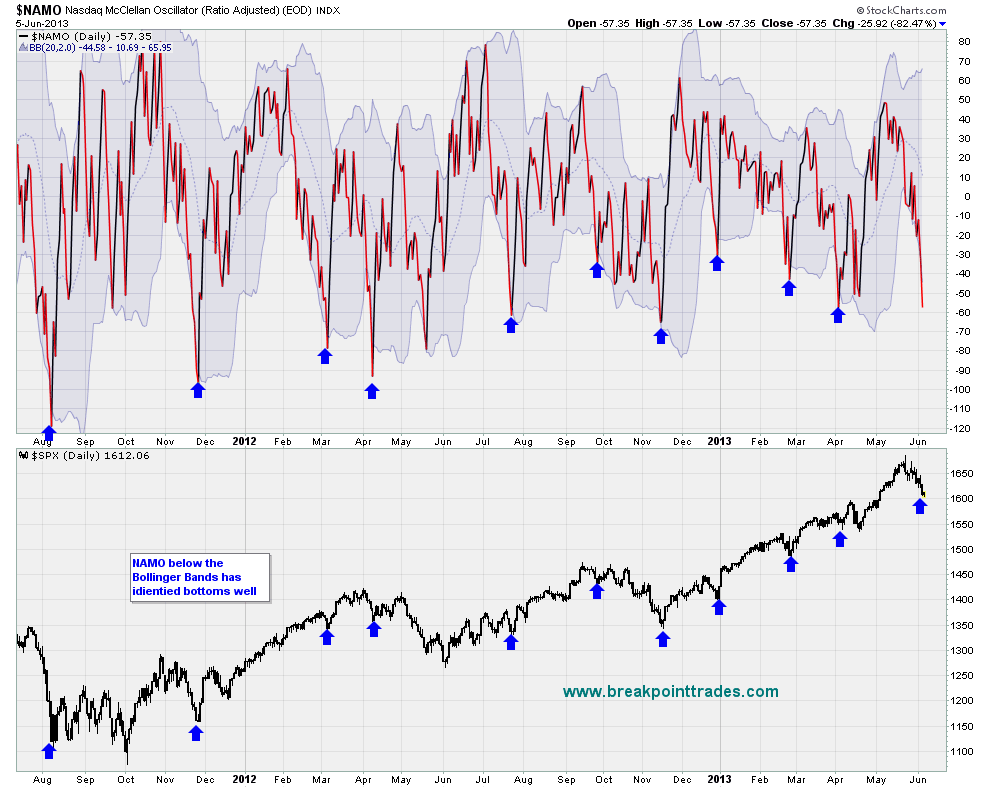
Good morning! Here's a couple of powerful indicators to monitor in the coming days with the market at least oversold in the short term.
The first one shows the NYSE Advance Issues, notice that it has spiked to lows that were associated with previous lows in the market. However note that the the spike low during last May was not the bottom - it did produce a slight market bounce but then the market sold off again and made one more new low to finally mark a bottom two weeks later in June. The spike low for the indicator in mid Nov was the bottom however - therefore which scenario do we get this time? Personally I lean toward one like last May where the indicator marked a bounce point but then another low was made, why? Because the market just came off of a very strong 6 month rally - therefore I think more time is ultimately needed before the final low is in place - remember the market has only been in a correction for 2 weeks - is that long enough to work off the overbought nature from 6 months of strong rallying? probably not.
The second indicator shows our famous NAMO with Bollinger Bands - notice that the NAMO closed below it's lower BB's yesterday, it has been good at marking some tradeable bottoms.


No comments:
Post a Comment