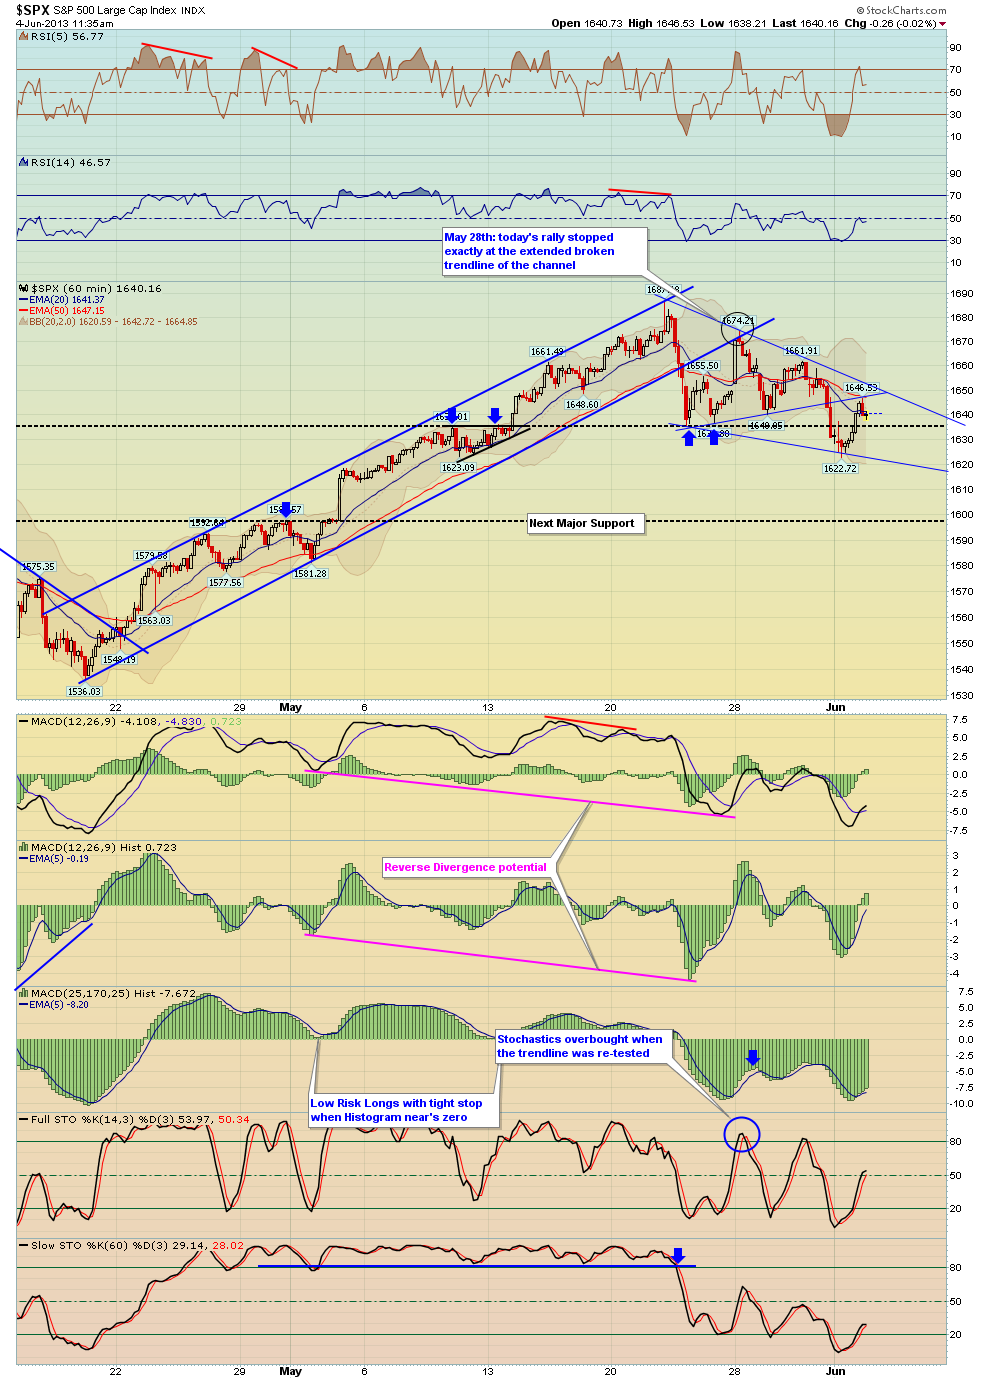
Here's a few charts from my newsletter last night - first off the SPX bounce from yesterday followed through this morning but notice that it stopped exactly at the broken trendline as shown on the 1st chart which is a 15 min chart.
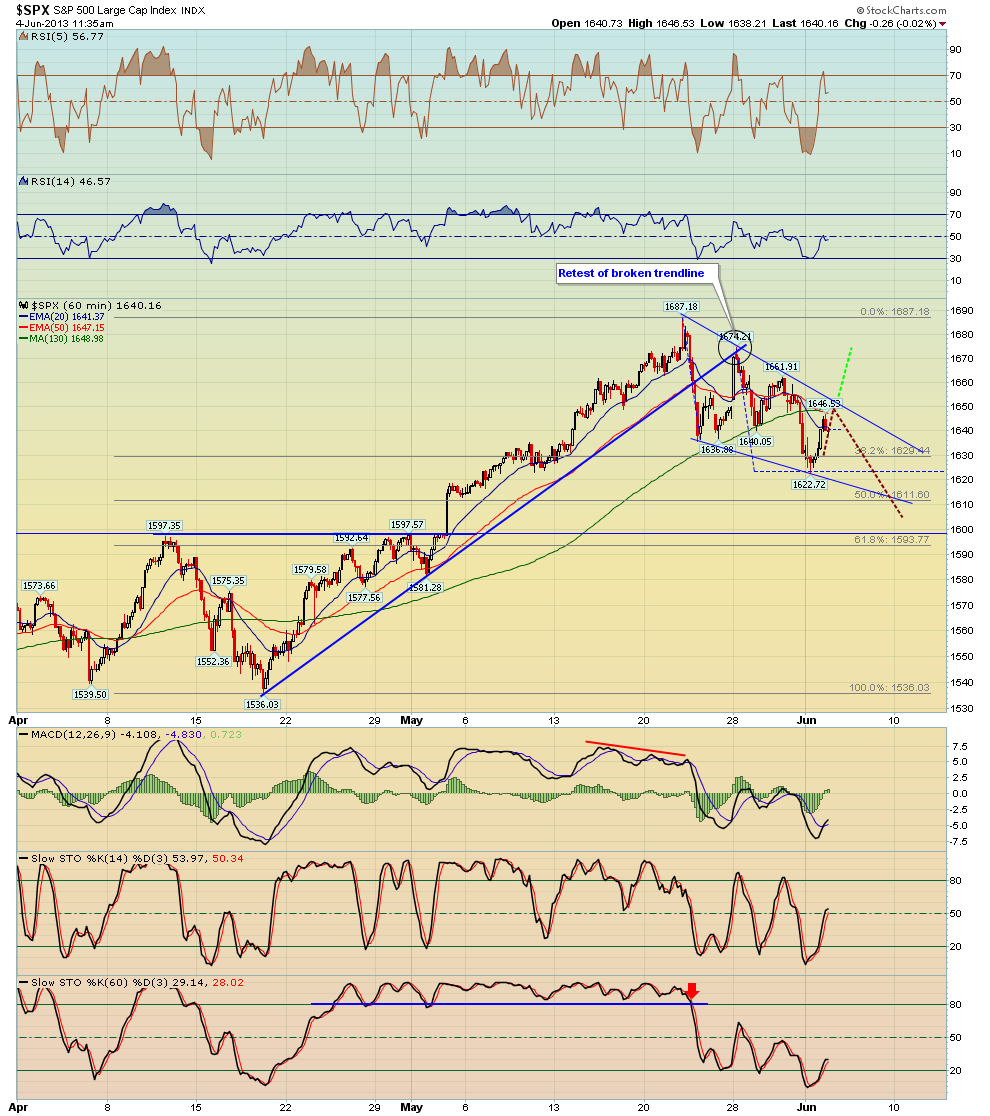
The next two charts are 60 min charts showing a potential wedge pattern. Resistance is clearly the downtrend line of the pattern. The first 60 min chart also shows the same broken trendline as the 15 min chart which was re-tested today. The second 60 min chart shows wedge scenario with 2 possibilities i.e. once scenario would break out of the pattern while the other one would have another sell off inside the pattern to the low 1600's and high 1500's. The downtrend line is major resistance

No comments:
Post a Comment