Nice bounce in gold stocks finally today, honestly it was about time and long over due, here's a look at NEM:
The first chart shows a big picture weekly chart, as you can see it bounced off the trendline from the 2000 lows, also take note of the RSI indicator at the top, it rarely get's oversold on the weekly and this time it had divergence to boot.
The second chart shows another weekly chart, which shows the divergence via the RSI a little better, however note the hammer candlestick which occurred this week, and NEM hit a measured move target
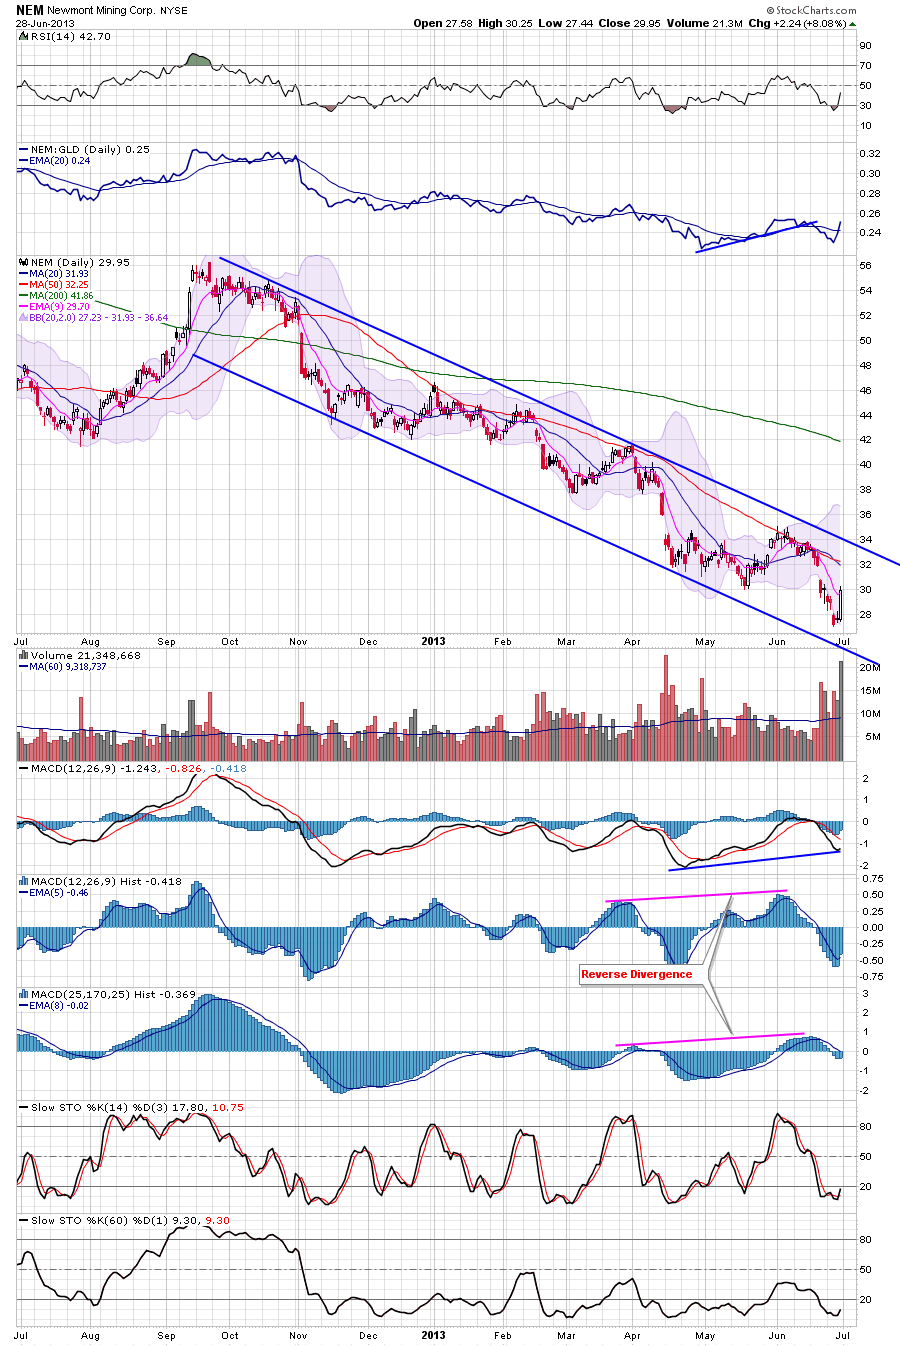
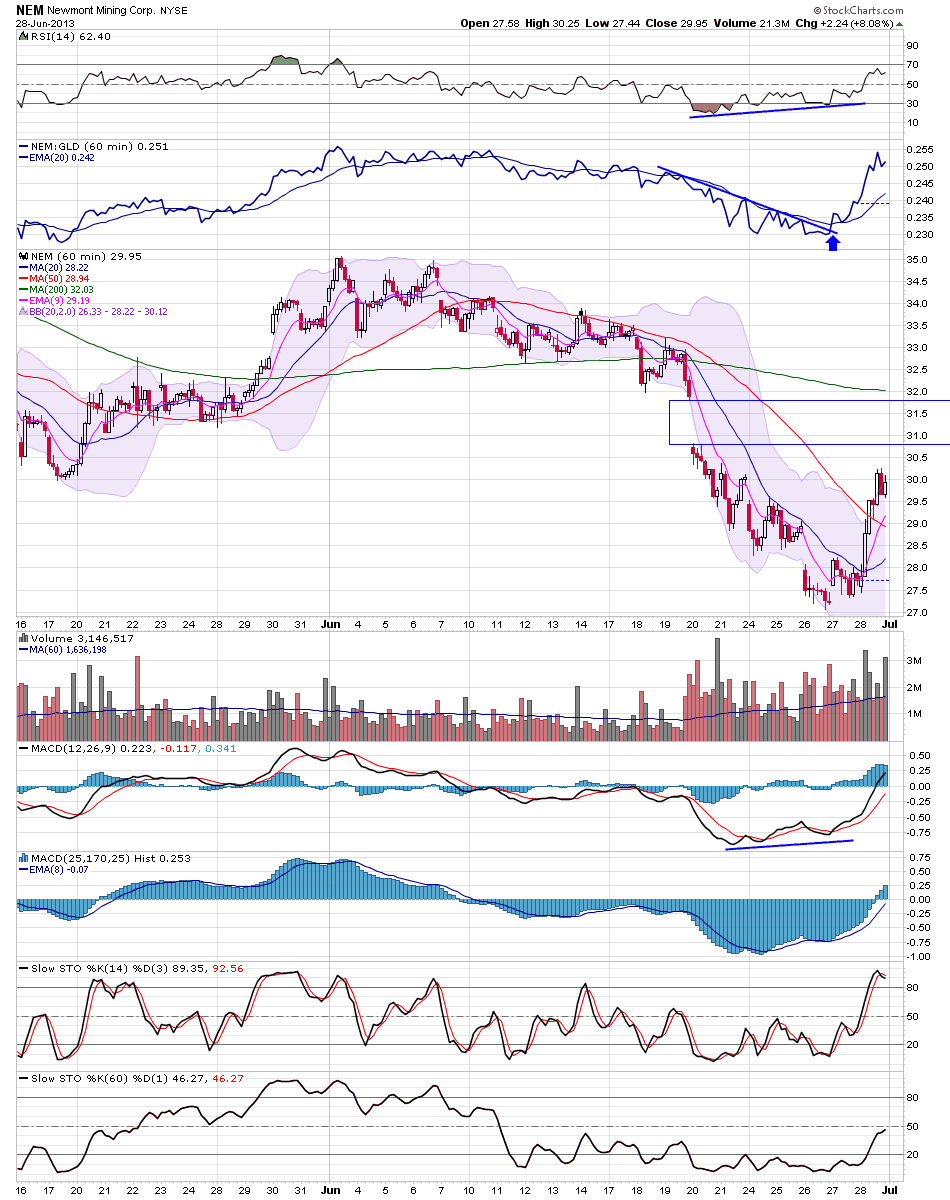
The third chart shows a daily chart with a well defined channel, while the last chart shows a 60 min view


No comments:
Post a Comment