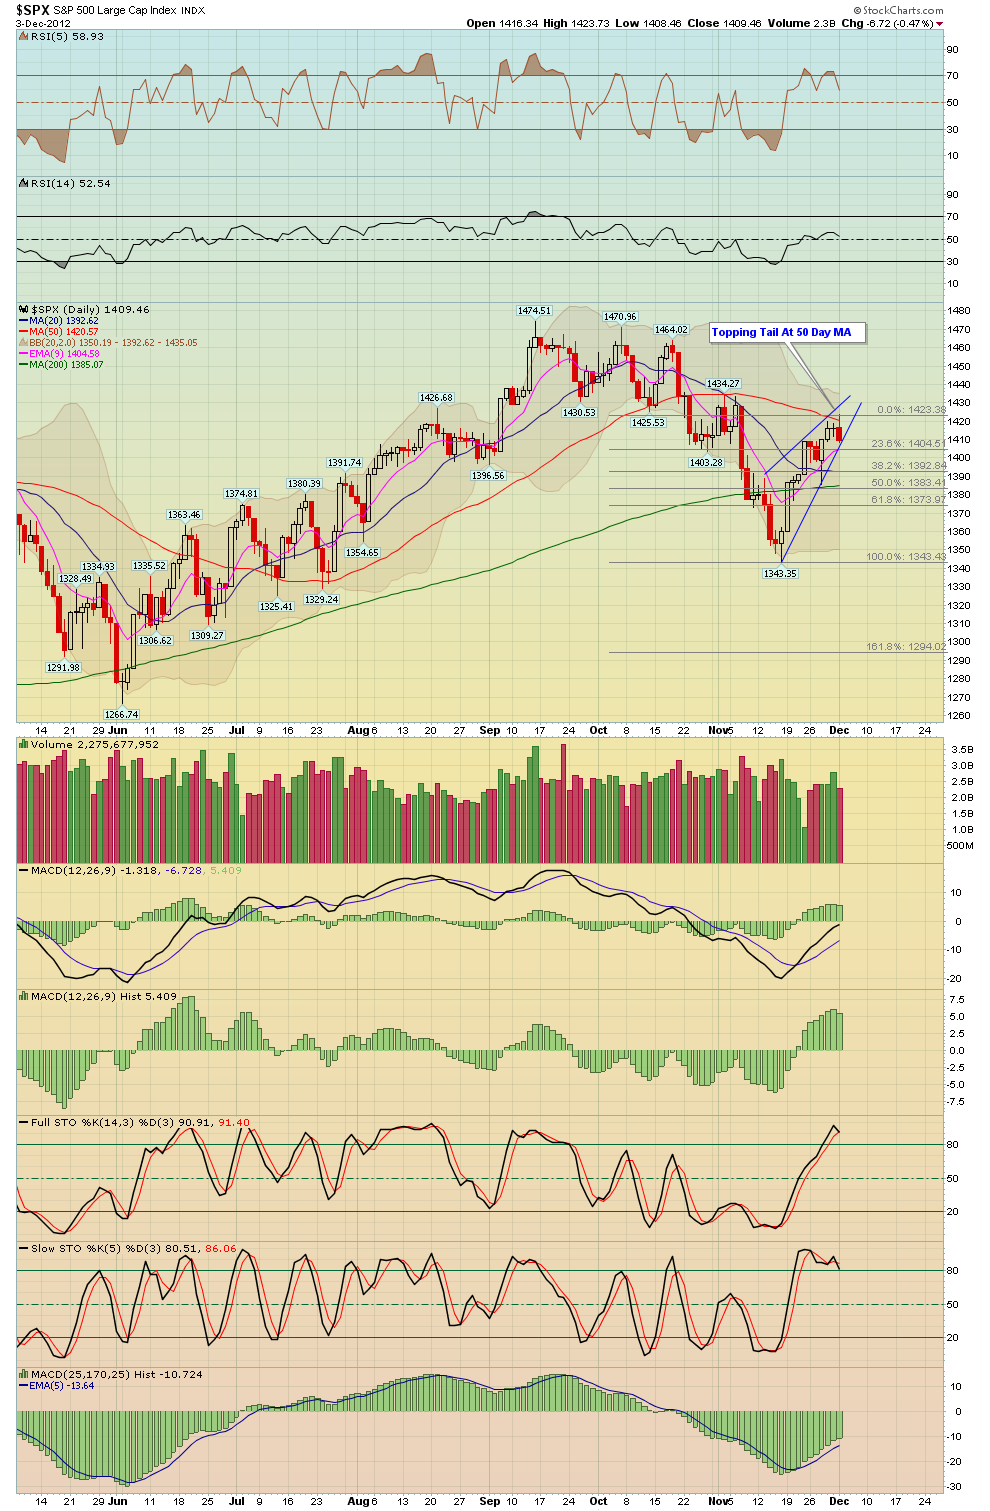
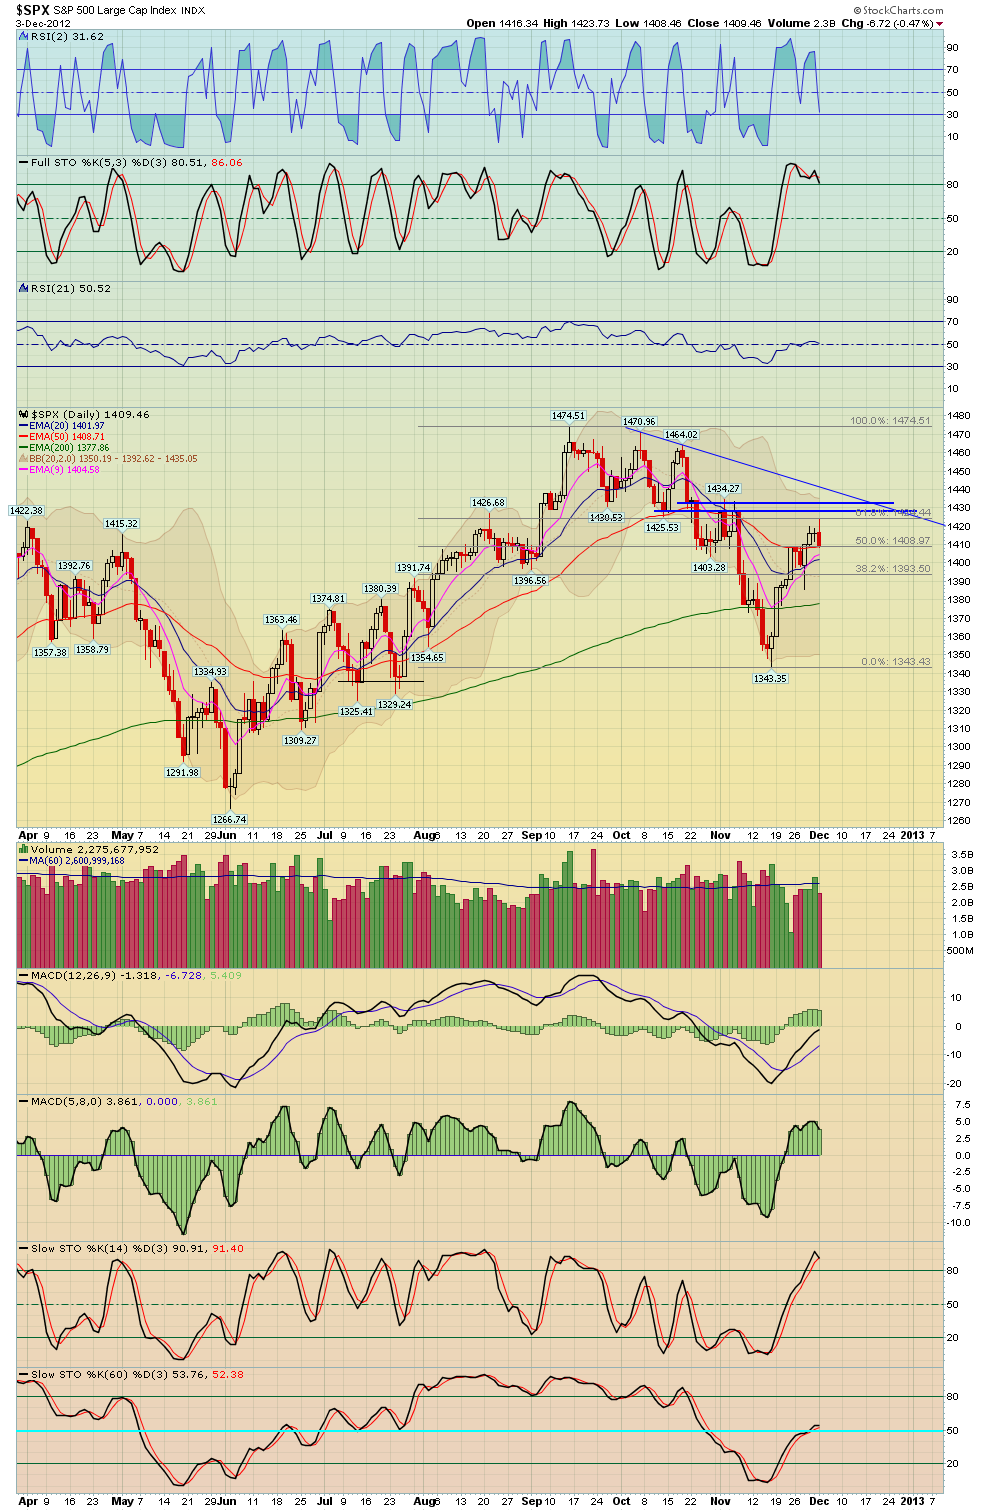
Here's three daily charts of the S&P 500, as you know the market had a nice rally off the mid Nov lows a few weeks back, however notice where the market stopped yesterday, it stopped dead a the 50 day MA! This was a logical place to exit longs or even take a low risk short with a tight stop. The first chart shows the reversal off the 50 MA, the second chart shows a small wedge pattern, while the last chart shows a higher level the market may try to hit should the 50 MA be broken.
A bullish scenario would have the market pulling back to form a RS of an inverse H&S pattern, however this would take at least a week or so since, so at best expect some chop in the market for the next week, at worst a decent top has been put in, however we are in the bullish time of year, so for now I favor some kind of higher low being established over the next week or two, we'll see...

No comments:
Post a Comment