Here's my most recent newsletter, I cover a ton of things from market analysis both short term and big picture views, AAPL which reported earnings today, precious metals, and trade ideas
Wednesday, January 23, 2013

Big Picture thoughts
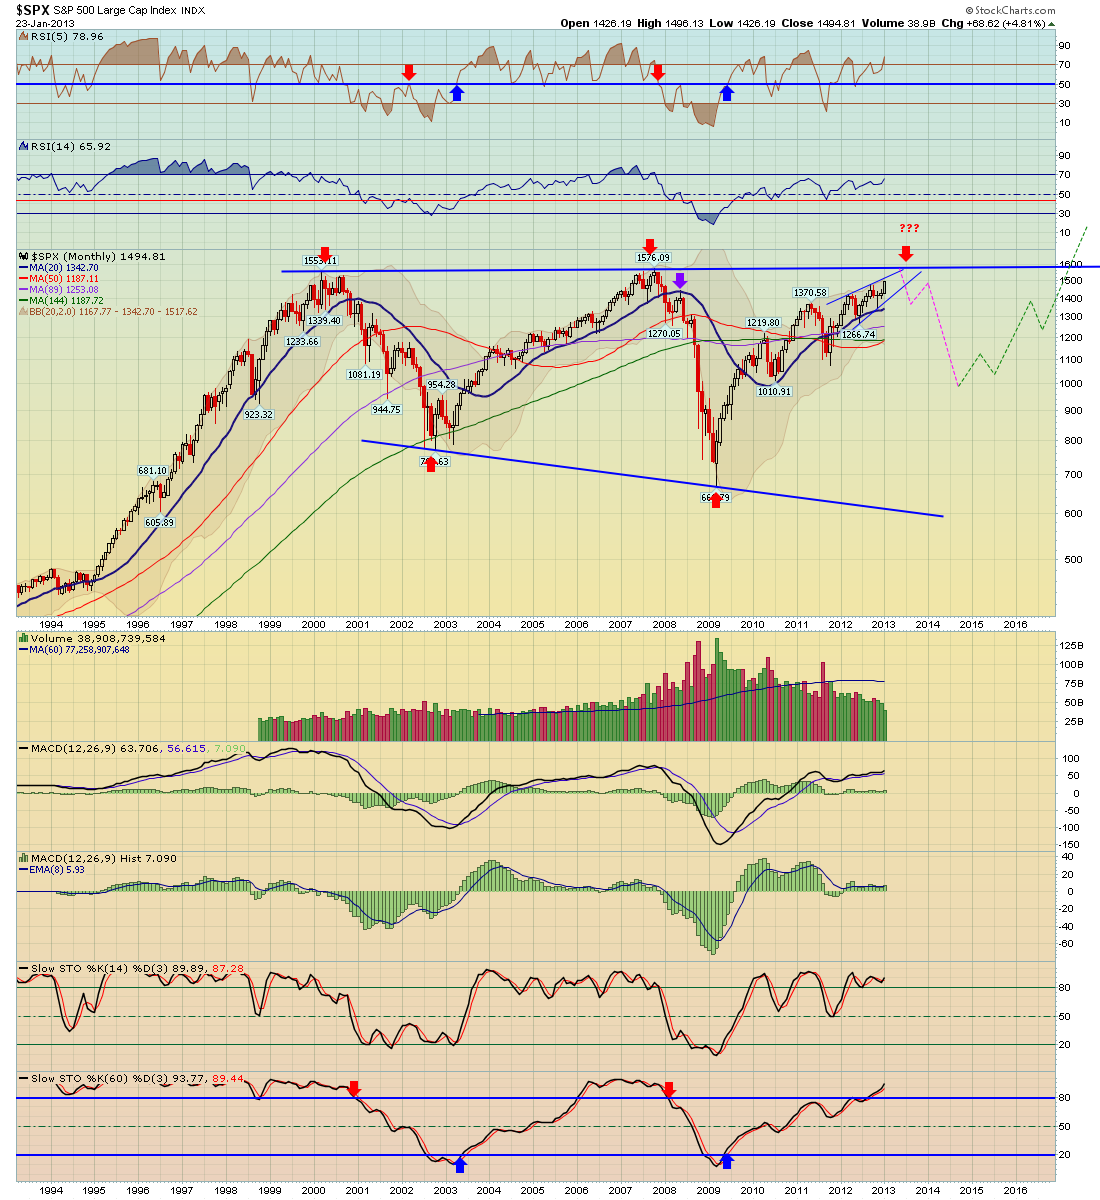
As you know, the market has come all way since the March 2009 bear market bottom where the S&P 500 hit a devils low of 666, today it stands just shy of 1500!
Here's a monthly chart of the S&P 500, potential targets for this year are 1550 - 1600 or the upper trendline (which also corresponds to roughly 1600. However my long term thoughts remain the same, I still consider this bull market, which began in Mar 09 as a cyclical bull market in a longer term Secular Bear market which began in 2000. Secular markets tend to last 16 - 18 years on average, this secular bear market is nearing 13 years now, so historically it's too short to be over. I think the market will be due for another down cycle perhaps later this year or next year - again one target could be the upper trendline of this monthly chart.
here's a history of secular markets, as you can see, they last more than 13 years:
2000 - Present, Secular Bear Market, 13 years so far
1982 - 2000 - Secular Bull Market, lasted 18 years
1966 - 1982 - Secular Bear Market, lasted 16 years
1948 - 1966 - Secular Bull Market, lasted 18 years
1929 - 1948 - Secular Bear Market, lasted 19 years
1920 - 1929 - Secular Bull Market, lasted only 9 /1/2 years (shortest one)
1904 - 1920 - Secular Bear Market, lasted 16 years
So as you can see from this history, I would expect this current secular bear market to not be over yet, I think we have one more down cycle to go through. I don't think the 2009 lows will be tested at all, however a 50% - 61.8% retracement could occur, then perhaps after it's over we'll be ready for the next secular bull market to begin in late 2016 or 2017. See my chart.
Long Term SPX system from 1961:
Of course whatever the market does, my long term long only system will catch the major trends, this system catches the majority of bull market moves and is out during bear markets. Notice that this system when to cash in Jan 2008 well before the big decline in 2008, then got back long in April 2009 and is still long

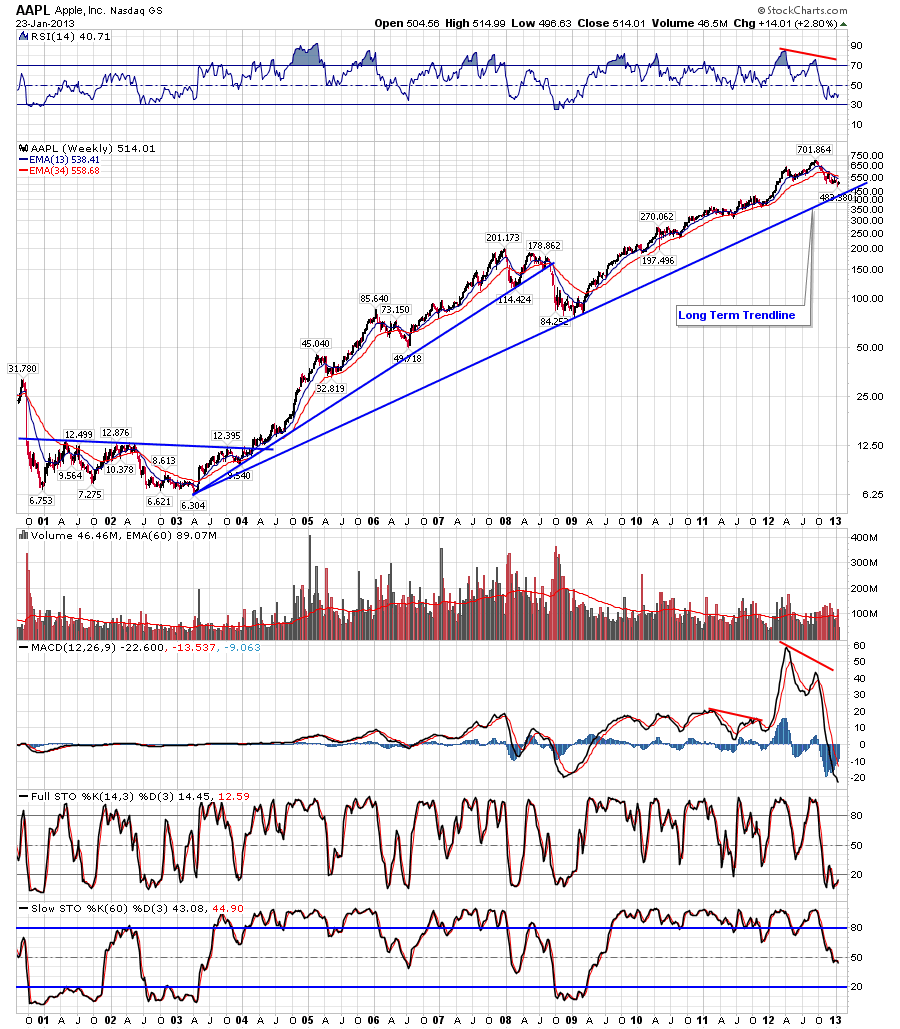
AAPL weekly chart - trendline coud be tested tomorrow
Here's my weekly chart of AAPL that I've shown many times; as you know AAPL missed on earnings and traded down -$50 after hrs to the $450's; this maybe this long term uptrend line form 2003 will be tested tomorrow
Tuesday, January 22, 2013
Here's some recent trade ideas of ours
NOV - Chart Link - inverse H&S pattern from last week, playing out
AUY - Chart Link - gold stock, one of the stronger ones today
GOLD - Chart Link - another gold stock
FWLT - Chart Link - nice
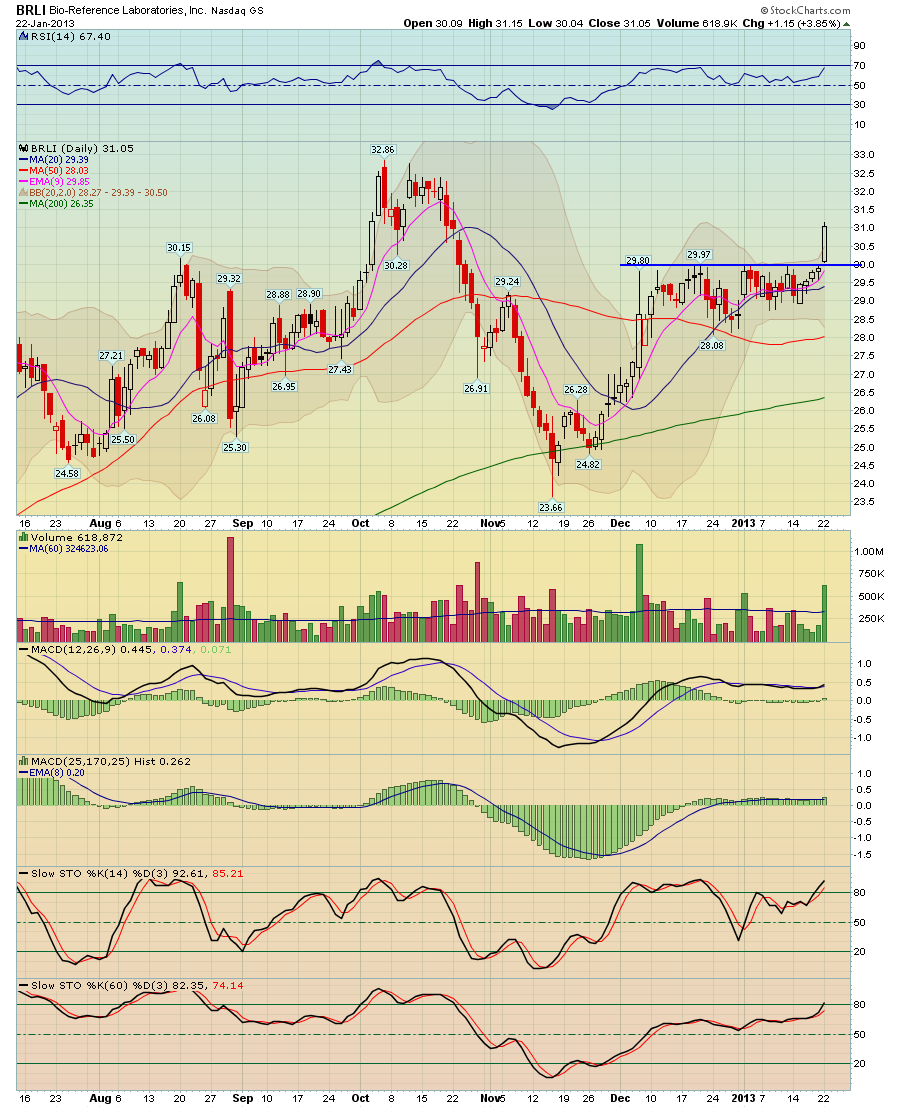
BRLI - Chart Link - pop!
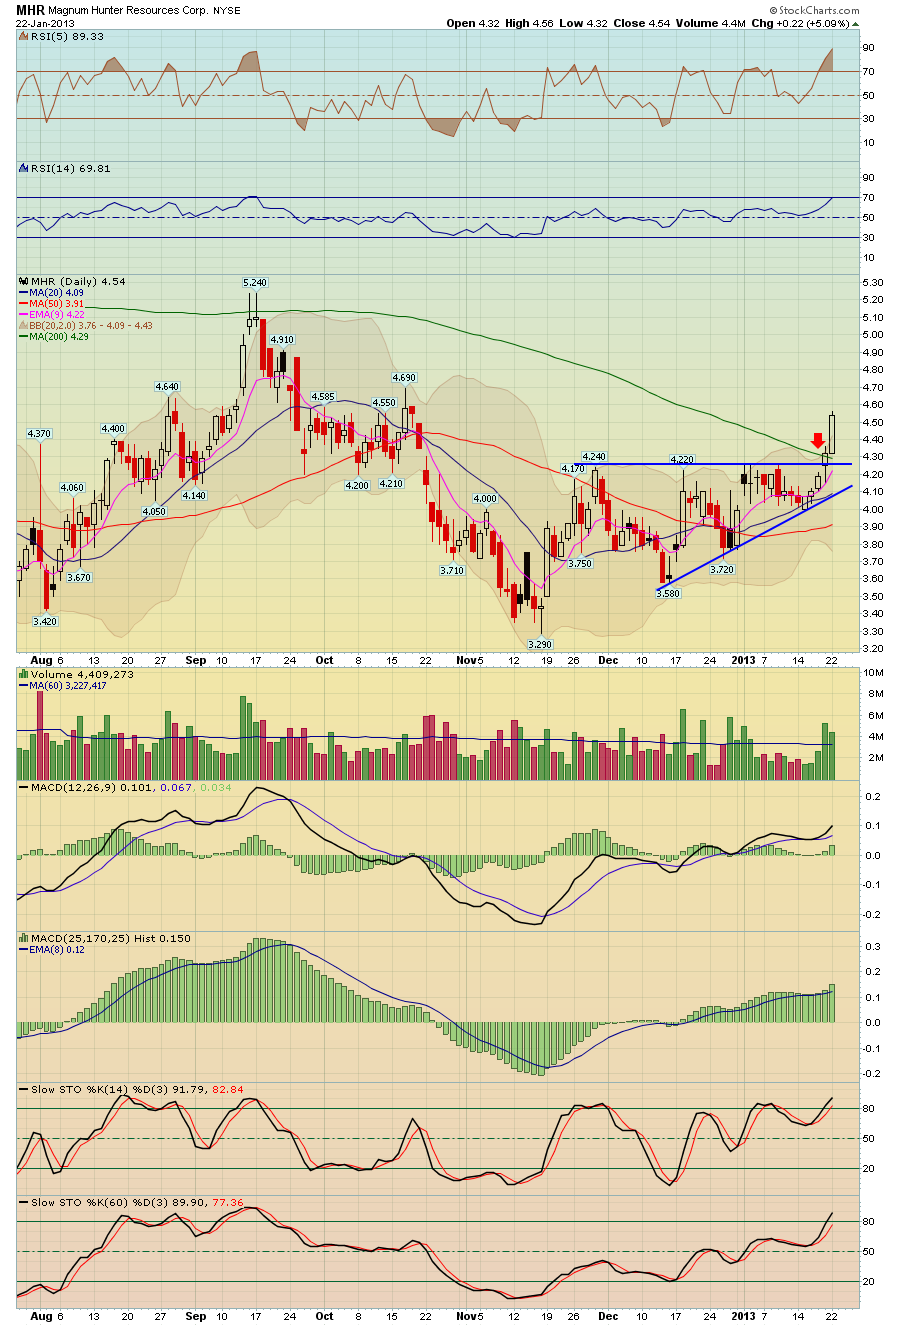
MHR - Chart Link - Pop!


A few pm stocks
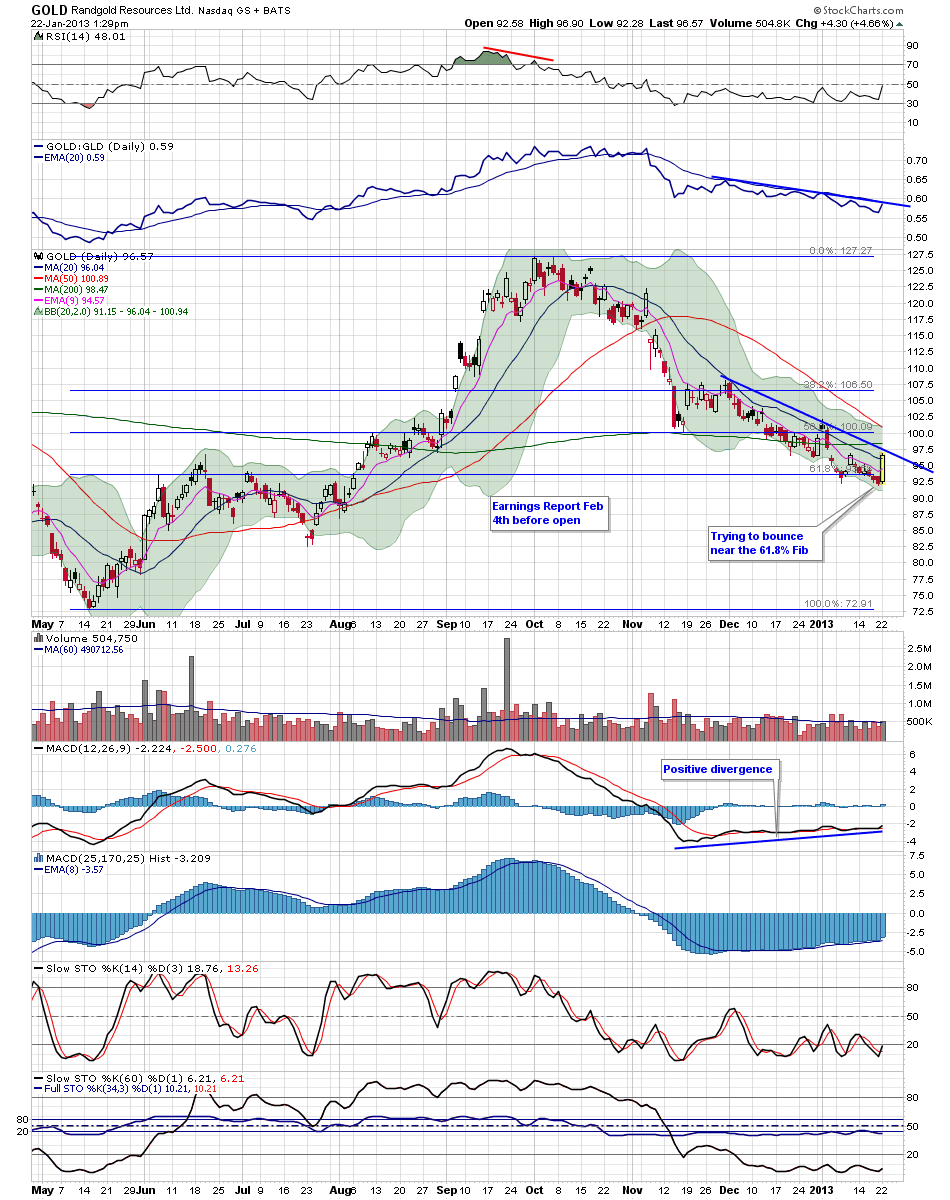
GOLD - Chart Link - in regards to my commodity newsletter, here's a few individual gold stocks that I currently own that have been standing out above the rest. Rangold is trying to bounce near the 61.8% Fibonacci retracement, obviously it still has yet to take out major resistance above via the trendlline, but it's holding up well
GG - Chart Link - been one of the better pm stocks lately
RGLD - Chart Link - has been finding support at the 200 day MA, needs to get going, but it's one I'm watching


Commodity Newsletter
I hope everyone had a nice long 3 day weekend as the market was closed on Monday due to MLK. Here's my Commodity Newsletter
Click here to see the Newsletter
good trading,
Matthew Frailey
Thursday, January 17, 2013
SPX 60 min follow up
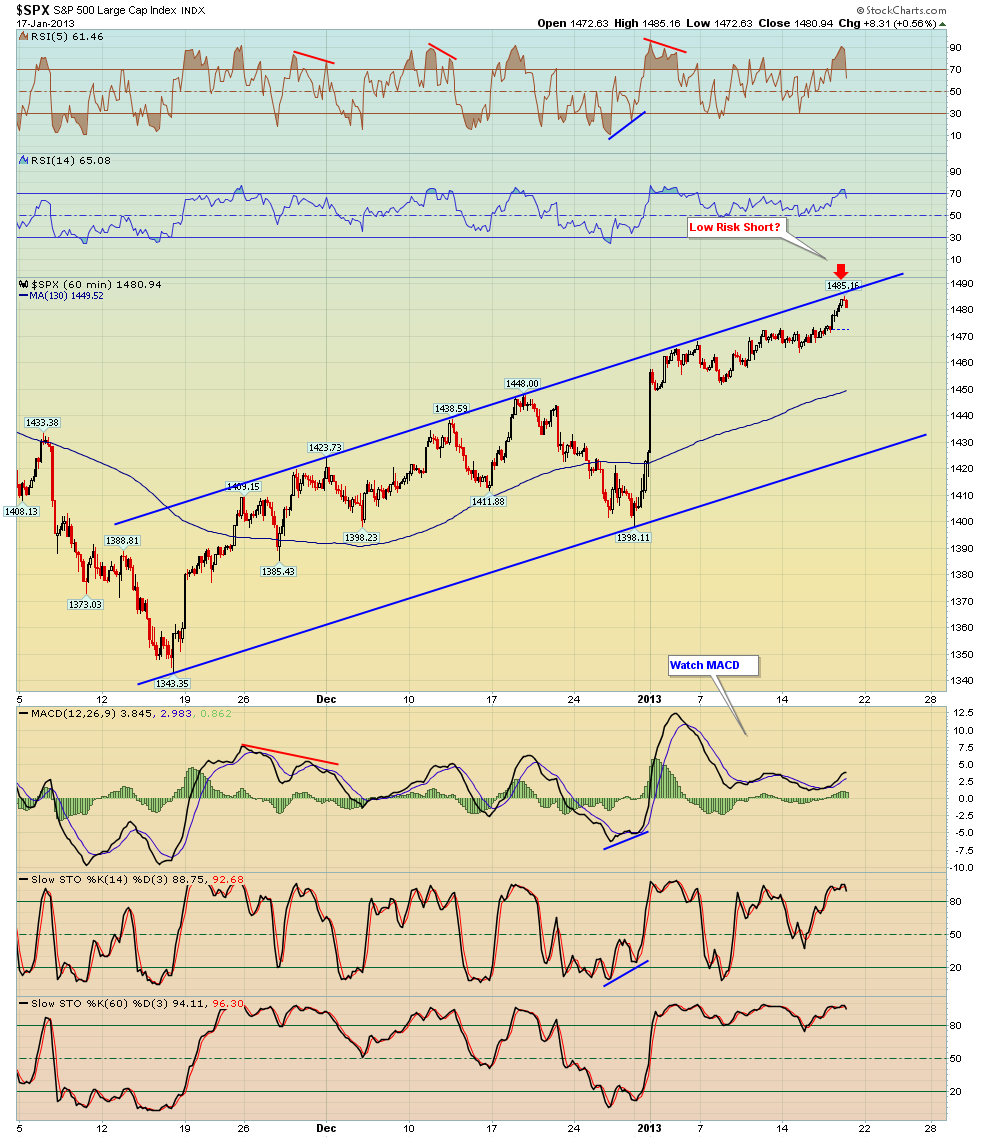
I posted this 60 min chart earlier today, the SPX had a strong intra day rally and got close to the upper trendline of the channel which is resistance - it's logical for the SPX to struggle there, now keep an eye on the MACD which is lagging and forming some negative divergence.
The second chart shows a 5 min SPX chart that I posted on live Breakpoint Trades blog intra day - notice the negative divergence that had set up late in the day via the MACD's and RSI was very extended - nice pullback late in the day.

VIX closing up
$VIX - Chart Link - Market is up nicely today, the VIX is also up, obviously folks are buying some protection hedges against their longs and technically the VIX is at a support trendline. Tomorrow is OPEX as well.
I seem to recall some statistics where the VIX and SPX both close up on the same, day, but I can't remember the results of that

Market Comments
$SPX - Chart Link - The market continues to push higher, as I said last night and Monday newsletter, I stated off with this daily chart, with the SPX above the 9 EMA, there was no reason to over analyze anything or get too bearish, the 9 EMA continues to act as a spring board.
$SPX - Chart Link - I'm watching the 60 min chart on this move up - watch to see if the upper trendline of the channel will act as resistance - that is also a low risk area for a short for folks like Kalinm
$SPX - Chart Link - 15 min ascending triangle, this has played out - RSI is overbought now so that's a short term concern - also tomorrow is OPEX, so I wouldn't be surprised to see some consolidation.
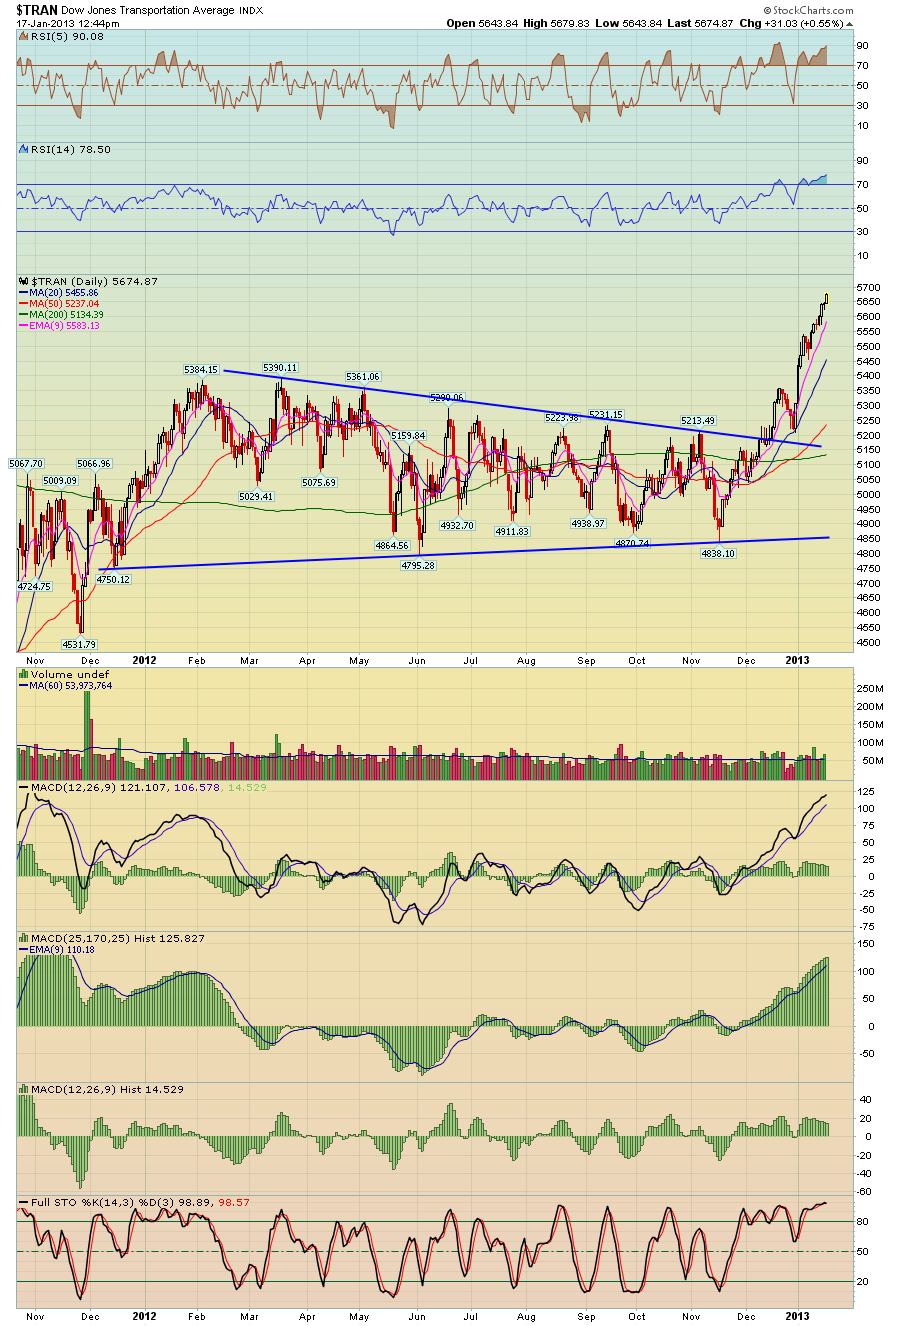
$TRAN - Chart Link - Transports continue to be on fire, holding the 9 EMA all along, IYT is the ETF of corse
$BKX - Chart Link - Banks have consolidated again, the MACD line is testing the average for a potential MACD Kiss for another pop and price is over the 9 EMA we'll see.
Otherwise for now monitor the 60 in SPX chart and the upper trendline of the channel and the 15 min SPX



Wednesday, January 16, 2013
AAPL comments
AAPL - Chart Link - as you know AAPL is up today, it was nearing the uptrend line on the linearly chart
AAPL - Chart Link - 15 min chart has a wedge pattern, which is playing out
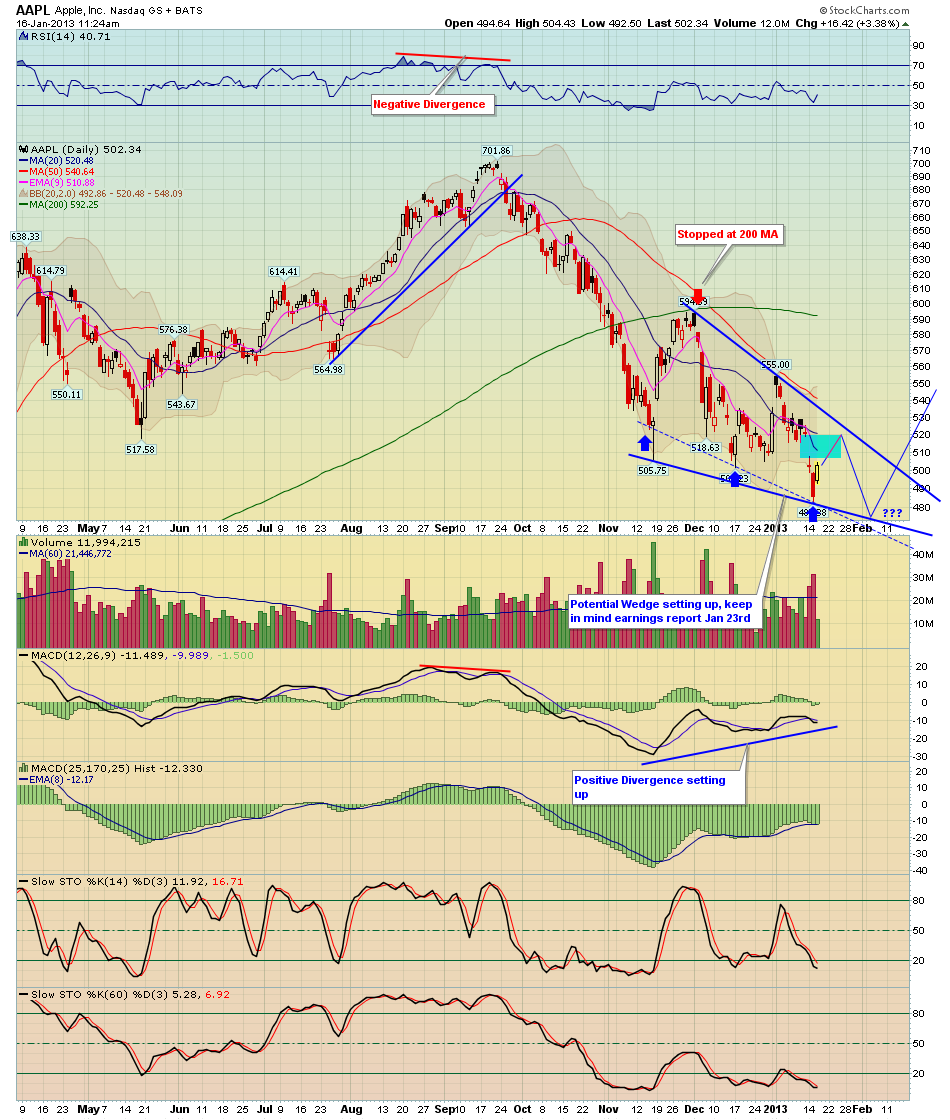
AAPL - Chart Link - Here's a daily chart and potential wedge scenario - under this scenario AAPL could push higher to fill the gap above, then have another pullback in the wedge, this would be be 5 waves for a much more complete wedge and under this scenario AAPL would still form another low after this bounce is complete. Obviously earnings next Wed could make or break the chart if the gap is sufficiently large.


Tuesday, January 15, 2013
AAPL - down again getting closer to the trendline
AAPL (some say Crapple LOL) down again, however it's getting closer to that uptrend line
remember it reports next Wed 23rd after the close

VIX comments
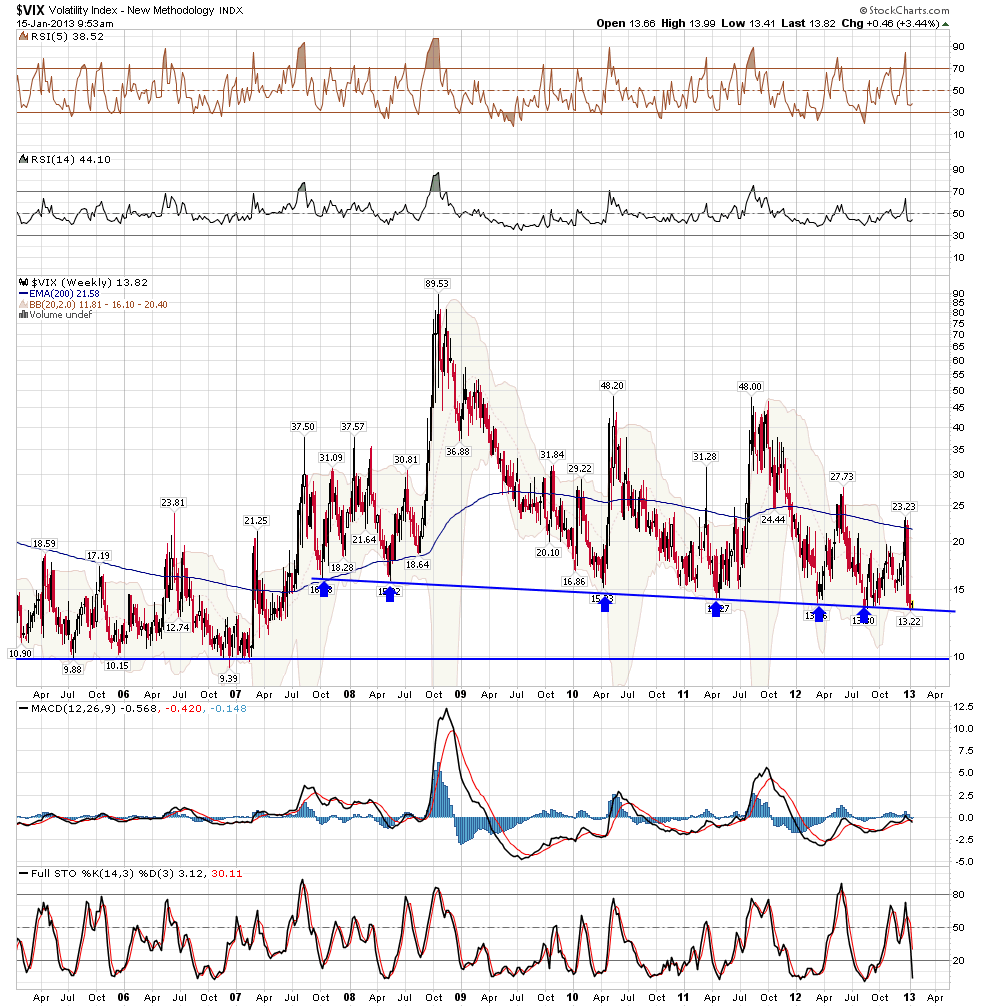
$VIX - Chart Link - The VIX (which moves inverse to the S&P 500), is at some support area where it may bounce
$VIX - Chart Link - weekly charts shows that this trendline goes back to 2007, so it's quite important
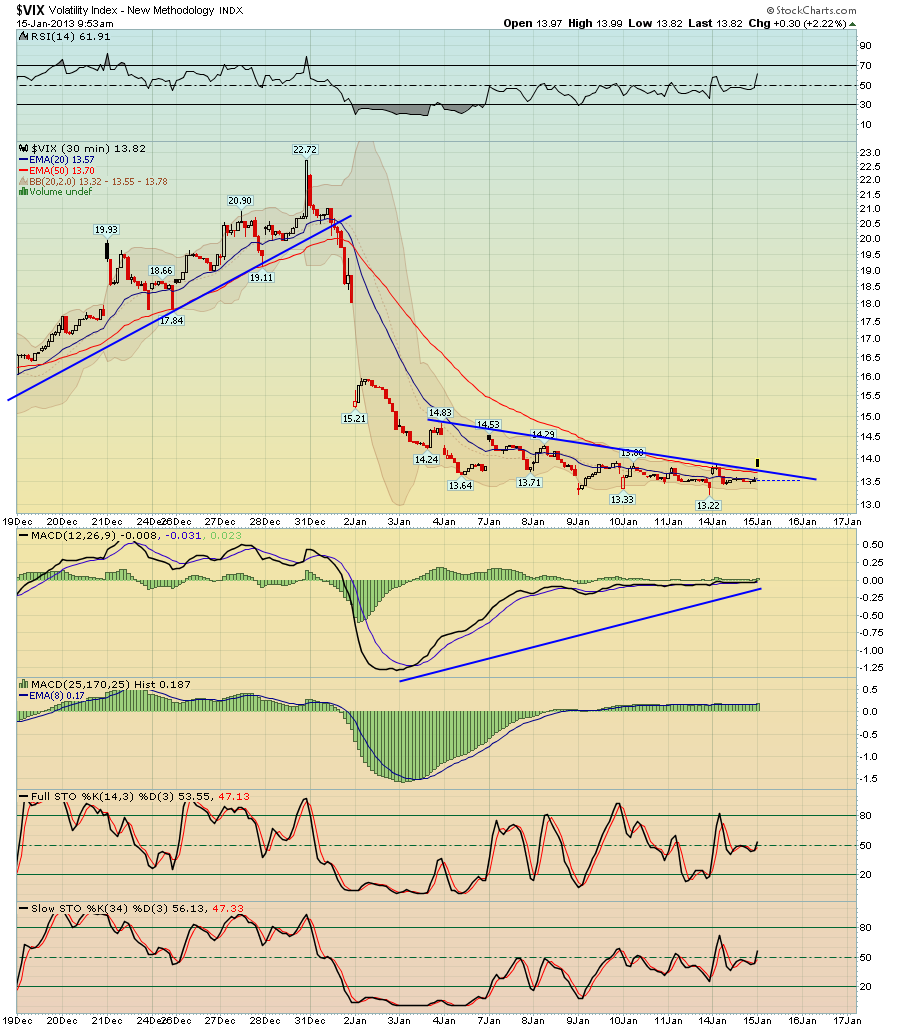
$VIX - Chart Link - short term 30 min chart - has quite a bit of positive divergence, therefore short term it also looks like it wants to bounce some.

Monday, January 14, 2013
Charts of AAPL to keep an eye on
I posted these charts quite a while while back showing the long term uptrend lines on AAPL in the upper $400's, say around $475 - $480 ish. clearly these trendlines are a magnet and price is being pulled down to them - AAPL is down -$20 this morning to $500. I think AAPL could be a low risk buy near those trendlines because a very tight stop can then be used i.e. if you are wrong, you stop out for a minimal loss
The first two charts are linear charts showing trendlines back to early 2009, while the third chart is a logarithmic chart showing a longer term trendline back to 2003


Sunday, January 13, 2013
Commodity Weekend Newsletter Jan 13th, 2013
I hope everyone enjoyed there weekend! Here's my weekly review of commodities
Commodities Weekend Newsletter Jan 13th, 2013
Thursday, January 10, 2013
Moon cycle tomorrow
Tomorrow is the Moon cycle, New Moon. The last cycle marked an inflection point low, will this one mark a shot term high?

Subscribe to:
Posts (Atom)