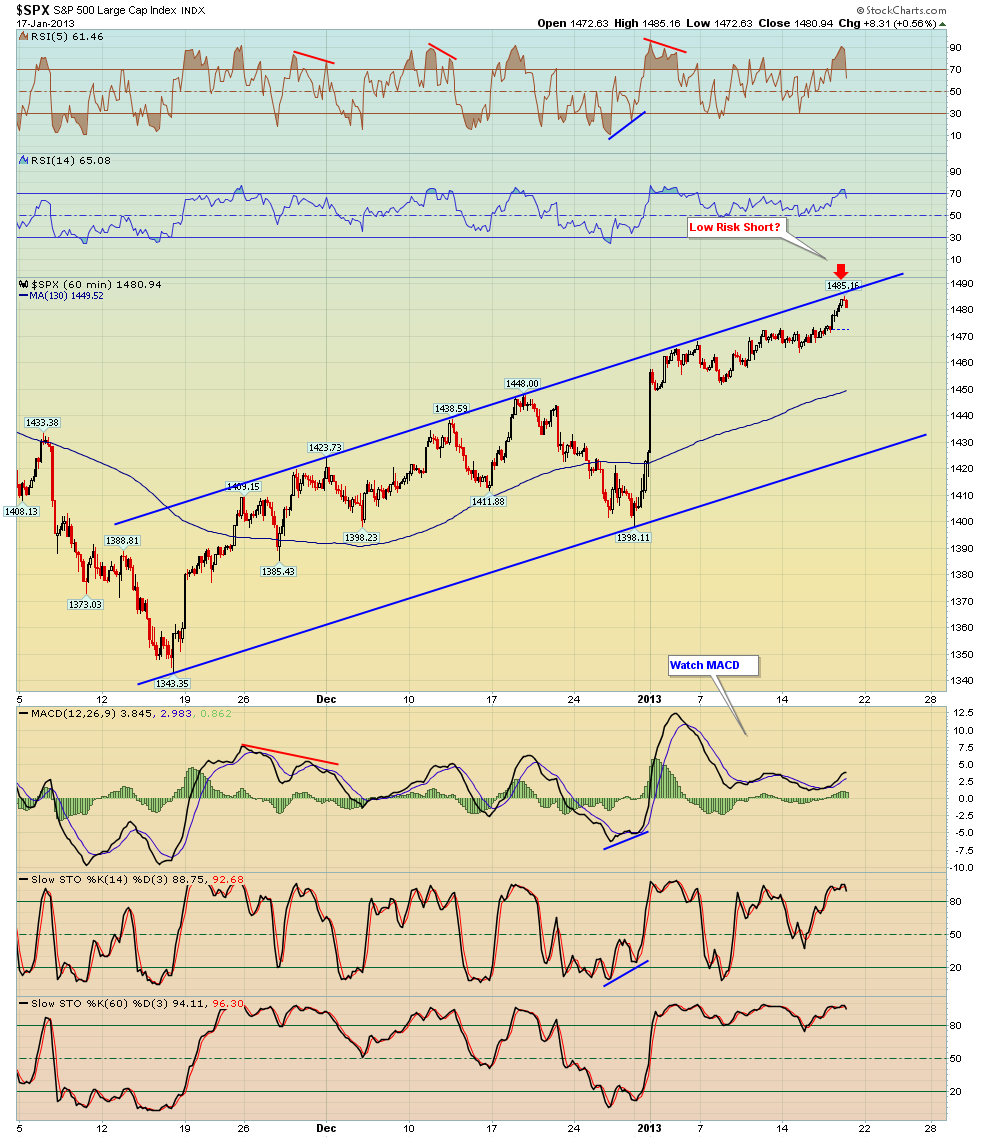
I posted this 60 min chart earlier today, the SPX had a strong intra day rally and got close to the upper trendline of the channel which is resistance - it's logical for the SPX to struggle there, now keep an eye on the MACD which is lagging and forming some negative divergence.
The second chart shows a 5 min SPX chart that I posted on live Breakpoint Trades blog intra day - notice the negative divergence that had set up late in the day via the MACD's and RSI was very extended - nice pullback late in the day.

No comments:
Post a Comment