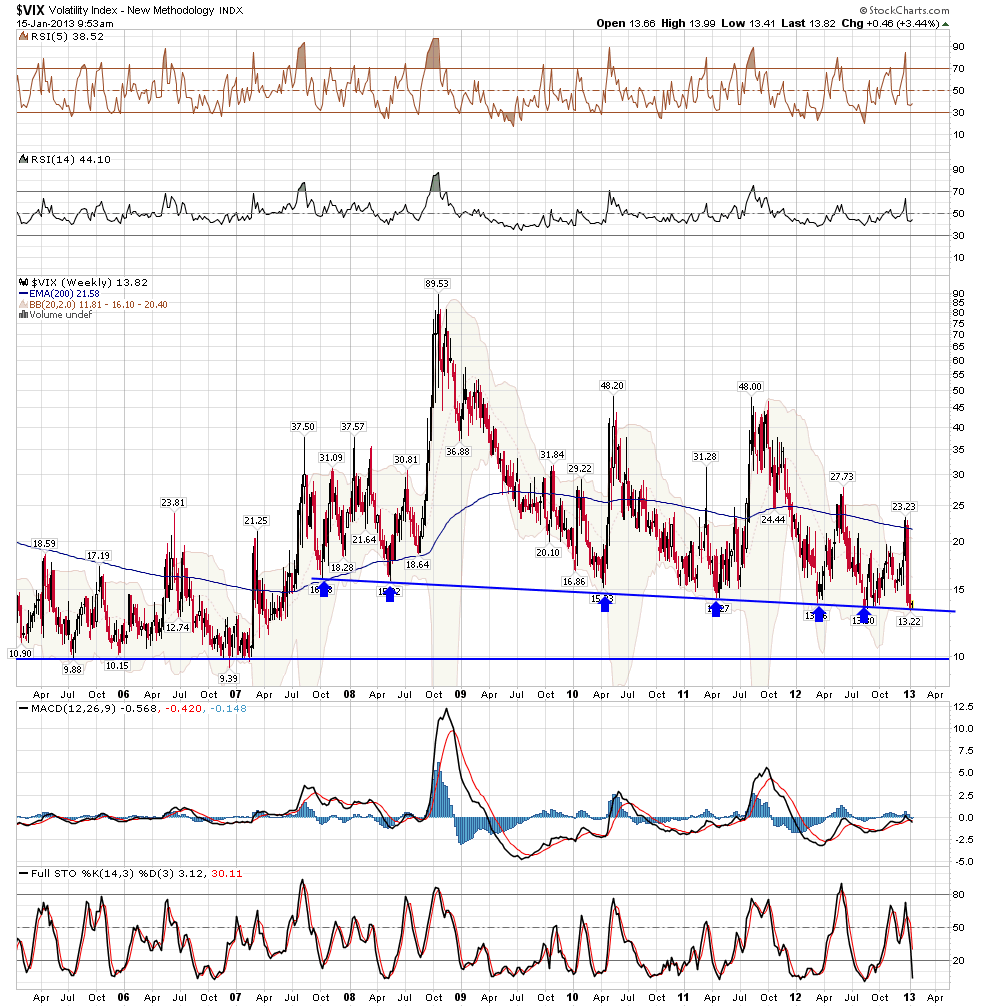
$VIX - Chart Link - The VIX (which moves inverse to the S&P 500), is at some support area where it may bounce
$VIX - Chart Link - weekly charts shows that this trendline goes back to 2007, so it's quite important
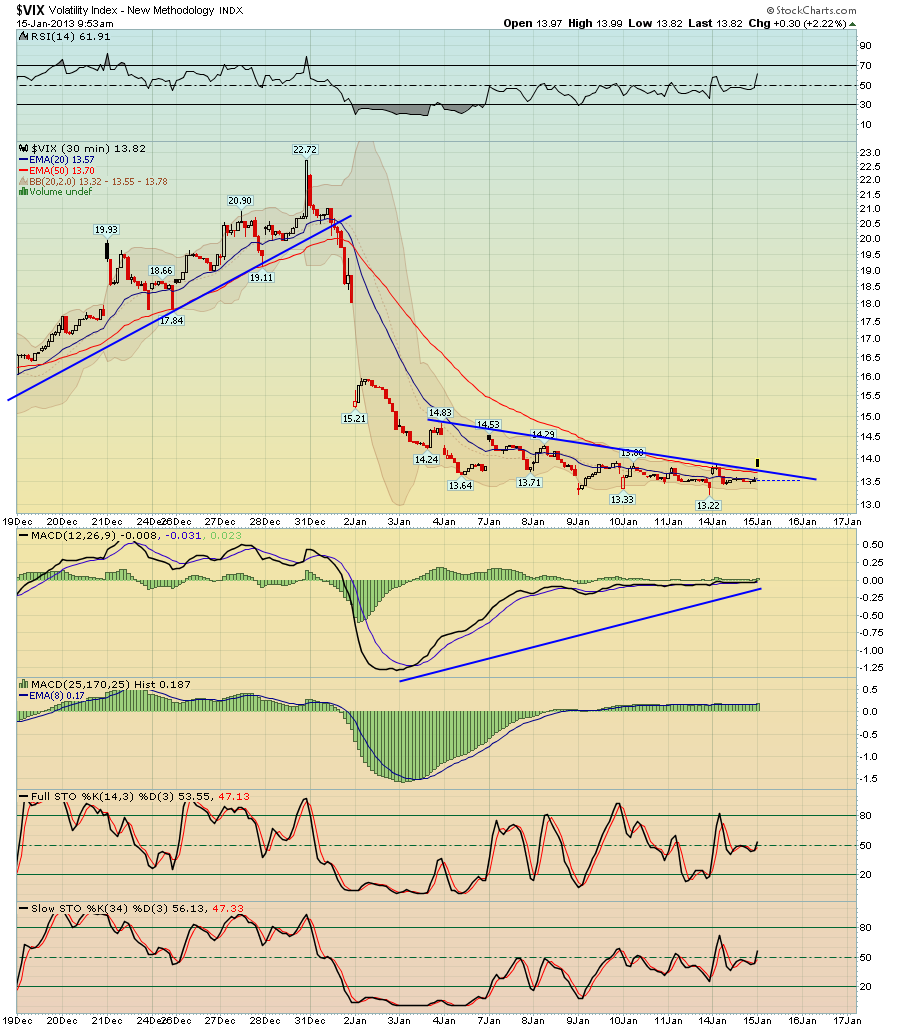
$VIX - Chart Link - short term 30 min chart - has quite a bit of positive divergence, therefore short term it also looks like it wants to bounce some.

No comments:
Post a Comment