Tuesday, May 14, 2013

Quick Market Update

Good morning everyone, as you know the market is up once again, the masses can't seem to buy this market fast enough LOL.  Again if you listened to my newsletter last night you heard my rant/speech about playing the trend vs being an ultra bear obsessed with picking tops - eventually you will be right but you will be broke before you catch that elusive top! 


Anyway here's a couple charts from my newsletter post last night: 


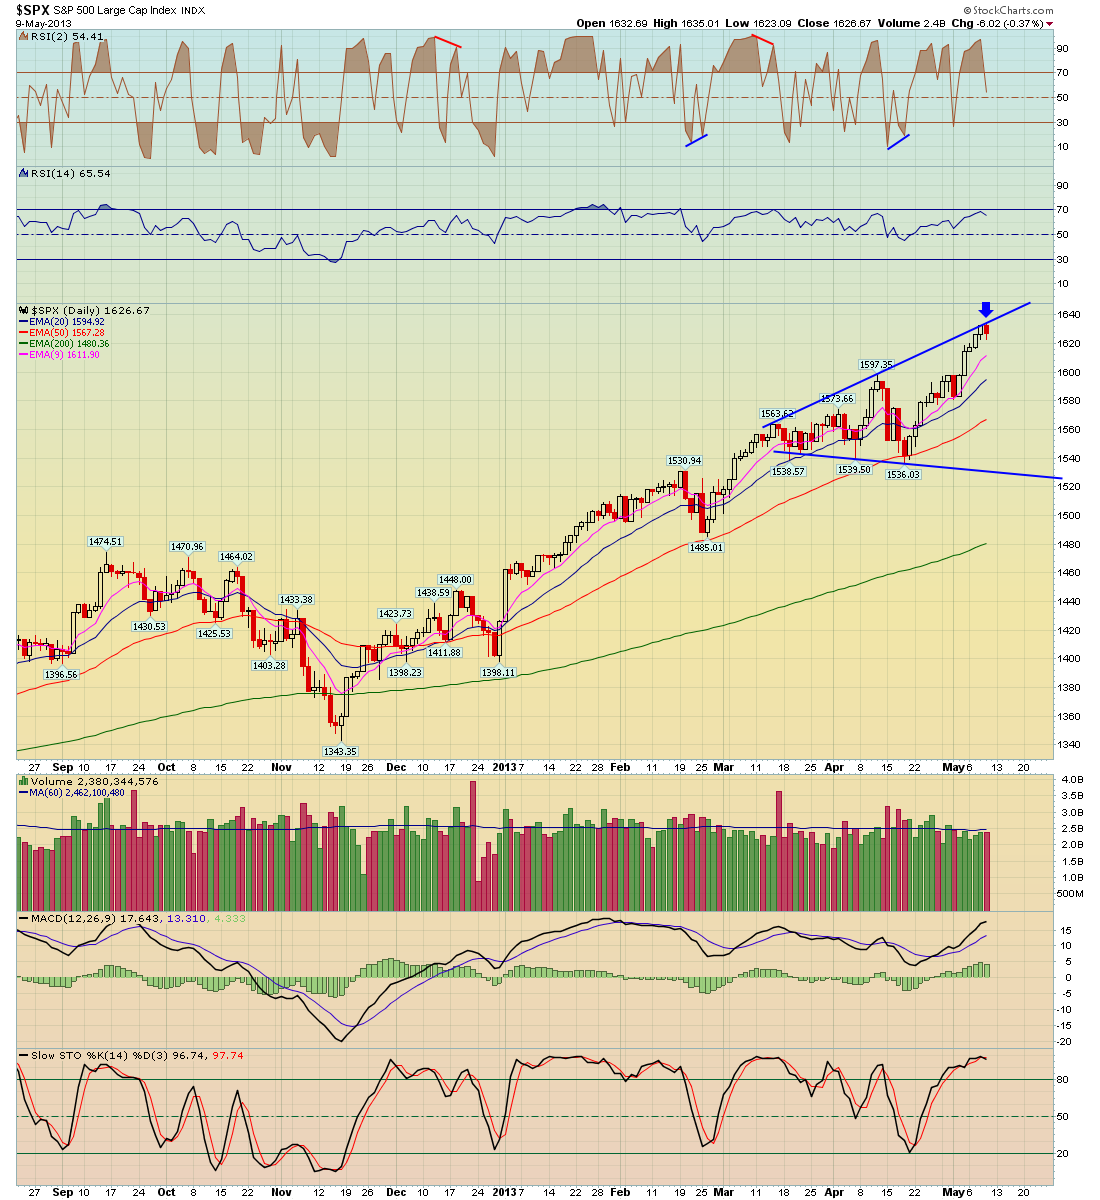
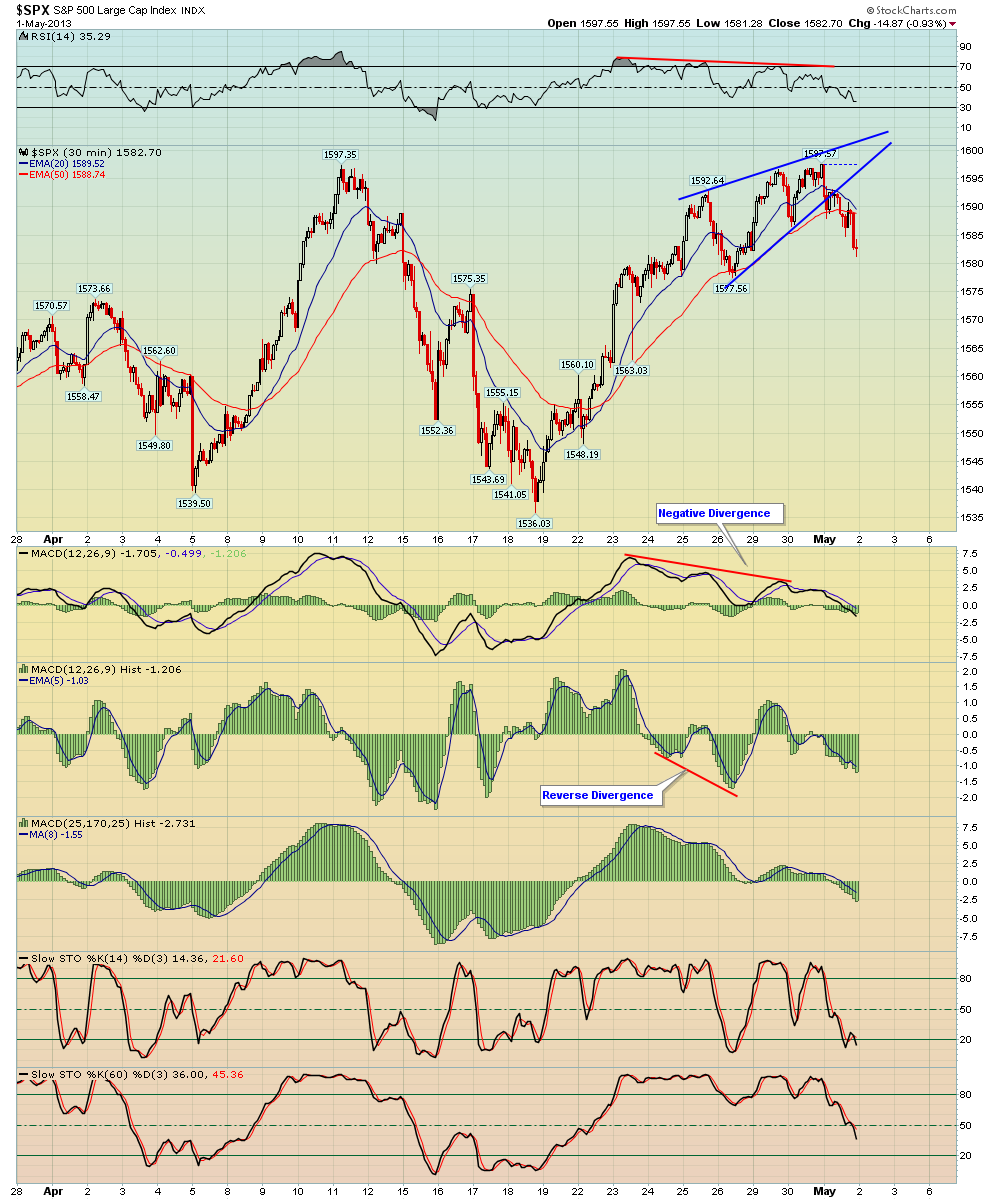
First a 60 min chart of the SPX, as you know it's in a sold uptrend channel and last night I showed the small ascending triangle pattern inside the channel (drawn in black), this pattern is 12 points in height and measures to a target of 1647 (12 + 1635).  The second chart shows the 5 min bull flag chart which I also showed last night and has basically met its price target.


This move up is forming some negative divergence on the 60 min SPX chart via the MACD and RSI and is something to monitor, but otherwise the trend is strong.  


We have had tons of long ideas posted on our Paid Website

Monday, May 13, 2013

Our most recent newsletter

Hello everyone, I hope you had a nice weekend!  Regarding the market, instead of posting a bunch of charts, here's my most recent newsletter

**CLICK HERE** to view the newsletter

Thursday, May 9, 2013

Our most recent Newsletter

The market finally pulled back some today, early this week I listed the upper trendlines of the channel patterns on the daily SPX charts as a target and today the SPX perfectly tagged those resistance trendlines and reversed off them.


**CLICK HERE** to listen to our most recent newsletter on the market


BPT MA deluxe moving average indicator

Here's the BPT MA deluxe MA, which is really just a fancy name for a moving average set that has tons and tons of settings.  It allows you to plot two MA's like at 20 and 50 or 50, 200 or whatever, and it also has 8 different moving average types that you can choose from (Simple, Exponential, Weighted, Triangle, Adaptive, Hull Weighted, Hull Expontial, and Hull Modified).  we can also plot just one MA and turn off the second (which is what I show in the sample charts).  It also slows the color of the slope of the MA (green when the slope is up and red when the slope is negative).


The last custom setting it has is a whipsaw factor.  You've all seen my use the BPT confirmation method where you need a second candle to confirm the first candle of an indicator change, I've shown this with various moving averages, MACD crosses, RSI above or below 50%, stochastics above or below 50%.  However I added a whipsaw confirmation method to this MA that only allows the slope to change color if it is confirmed by a second color - this turns it into more of a trending indicator.  I've attached some images below of daily and monthly S&P 500 charts.  The setting that I'm using is a 34 length exponential modified MA (our #8 MA) with the whipsaw confirmation turned on, as you can see it's done a great job at catching most of the trends.


For BPT members who have Tradestation I'm going to give you this indicator and a workspace for free so that you can play around with different settings and follow it on your own!  


Again note that even though the indicator appears to follow trend very well, I still don't like to use it on its own, I use it as a tool with other things and analysis.  For example on the monthly chart, I've found that whenever the RSI is oversold (which is a rare event on monthly charts), it's best to enter a long earlier than wanting for the MA to turn green - I've found taking the first MACD/BB green dot gets you in early (but only doing this when the monthly RSI was in a deeply oversold condition below 30%).  The first three charts show monthly S&P 500 charts while the last 2 charts show daily S&P charts, one recent and while from the past.


On the daily charts as you can see it's been green since mid November so has caught this whole move.


**Click Here** to watch a detailed video of how this indicator works and how to use it


I will be giving this indicator to all BPT members for free who have a Tradestation account.  However it's only for BPT members not free trial members (so sign up) if you want it.

Wednesday, May 8, 2013

Hapyy Fibonacci Day, 5/8/13

Today (5/8/13) is Fibonacci day and also my daughter Olivia's Birthday!  I tried to name her Fibonacci when she was born by my wife wouldn't let me :)

Video update on today's action in gold stocks


Here's a 7 1/2 video update I made on GDX and select individual gold/pm stocks and what I"m watching and looking for should they continue to hold up today - remember it's VERY important that they close strong, if they give up a lot of gains by the close then it's just another fake out

CLICK HERE to watch the video


Tuesday, May 7, 2013

SPX daily follow up

Getting closer to the upper trendline of the channel - watching for a low risk short there because a very tight stop can be employed.  Trading is NOT about certainties or being right all the time, trading is about taking low risk trades where you see an opportunity where your risk is small and the reward potential is high i.e. at least 1:3 risk/reward ratio.  If the SPX fails to stop at that trendline and you are stopped out, no big deal, that's trading, but you don't lose much because you took a short right at resistance.  


The S&P 500 is up 7.5 points today, it's getting close, let's see if it can tag it. 

Monday, May 6, 2013

Market Update

I hope everyone had a nice weekend!  Otherwise regarding the market, there's nothing new to add at this point, the market is up slightly today - here's the daily S&P 500 chart that I'm monitoring; as you can see it's been in an uptrend channel since November.  After last Friday's big pop on the jobs report, I'm watching to see if the SPX can tag the upper trend line (or get close to it) of this channel - that's resistance and would be set up a low risk short because a tight stop could be used - i.e. short resistance when possible vs chasing oversold sell-offs.  

Friday, May 3, 2013

SPX daily charts/comments

Here's a few S&P 500 charts, as you know the market is up huge today on the Jobs data, a fairly broad based rally (except for gold stocks remain pretty horrid).  Copper is huge HUGE today, up over 6.7%!!


Regarding the daily S&P 500 charts, one target to the upside may be the upper trendline of the channel, the second chart show an expanding triangle, again the uptrend trendline could be a target should it push higher.


The 3rd chart is our daily pivots chart for the SPX, as we have been stating, if the 1597 pivot was cleared, that would open the door for a quick push up to the next pivot at 1614 and clearly we've had that today.  The next pivot beyond 1614 is 1628.


Clearly it's tough to chase longs up there unless for short term trades.  It's Friday, I would avoid chasing any new long at this point without a pullback.

Here are the employment numbers, positive report

Here are the employment numbers…

unemployment rate: 7.5% (was 7.6% last month)
nonfarm payrolls: +165K
private payrolls:
average workweek: down 0.2 hours to 34.4
hourly wages: up 4 cents to $23.87

February and March were revised up a combined 124K.  What stands out are the revisions to the past data, that is a positive report and the market obviously likes it!

On the news S&P futures jumped about 12 points and is testing the R2 pivot on ES, and likewise gold is down, Crude oil is up and copper is way up.  We'll how it opens and if it strengthens or weakens on the gap.  

Thursday, May 2, 2013

Market Recap

Well....the market sure is resilient isn't it!  Of course it helps that all the world banks are willing to print endless money/liquidity to help fuel the markets higher, today the ECB lowered rates as expected.  Tomorrow we have the US Jobs numbers, let's see how the market reacts to those!


Today the S&P recovered all of yesterday's losses and is once again testing the 1597 highs.  Yesterday the SPY and S&P 500 indexes closed right on their 9 EMA's, when a stock or index is still above its short term 9 day EMA, the trend is still up and more follow through to the downside was needed to confirm yesterday's pullback and we didn't get it.  The 30 and 60 min bear wedge patterns that I showed yesterday morning played out to their initial targets and have now rebounded back to retest the broken trendline on these wedge patterns - this is a breakpoint, tomorrow is do or die, i.e. either reverse back down or plow through!


enjoy the rest of your day or evening,


Matt

Wednesday, May 1, 2013

Sell in May and go away Statistics and Excel Sheet

Since it's now May 1st, it's an appropriate time to once again bring up my Sell in May and go Away Statistics.  Here's a table that I made in Excel some years back which I update every year; I divide the table into 3 columns going back to 1950 starting with a $10,000 investment.  The column on the left shows what would happen if you took $10,000 and invested it into the Dow Jones starting from 1950 only in the 6 month time frame between May 1st to Oct 31, while the second column directly to the right shows the results if you invested your $10,000 in the other 6 month time frame from Nov 1st to April 30th, while the column on the right shows a simply buy and hold. 


The results are quite astonishing!  $10,000 invested ONLY in the May 1st to Oct 31st time frame every year starting from 1950 actually LOST MONEY!! Your $10,000 turned into $9759!  Obviously this is minus dividends and interest of course, however this is astounding because as you can see, the same $10,000 invested in the opposite 6 month time frame from Nov 1st to April 30th grew to $918,000!!  Also notice that the buy and hold turned into $758,000.  


What this tells you is that historically most of the market gains were made in the the 6 months time frame from Nov 1st - April 30th!


I also include two visual charts on the right to really put this into perspective


It's now May 1st, will this play out once again this year?  This phenomenon has played out the last 3 years to a certain degree with big sell offs in the May time frame, we shall see.


If you would like a copy of this Excel file, simply send me an email or join Breakpoint Trades

Market Close and follow up to my morning post

I hope you paid attention to my post from this morning before the market opened, I showed how the S&P 500 had very clear bear wedge patterns on their 30, 60, and 15 min charts, and those are beginning to play out as the market had a nice correction today, here's a URL to the post.  Today the SPX closed right on the 9 day EMA and that's short term support, we'll see what happens tomorrow, but clearly the bear wedge patterns on the short term chart were something to take heed of.


Tomorrow we have the ECB, and Friday of course the 'manipulated' Jobs report will be release 1 hr before the market opens.


It's also May 1st, can we get a sell in May effect?

Comments on Gold and GDX


Gold is down over -$27 this morning, it was logically rejected at the 20 day MA and GLD exactly filled the gap.  The bounce off the lows was quite V-ish, therefore some backfill is only logical, now can it form a higher low or not? See the first two charts of GLD.


Regarding GDX, it's off the lows from a couple weeks ago however the advance has been choppy, that's why we always tell our members to get out of the habit of trying to pick exact tops and bottoms for stocks and the market, because even if you catch it, generally price goes through fits and starts and chop, which can make traders very emotional (and emotion is the enemy with trading), and let's face it who catches the exact top or bottom the first time, no one.  


It's best to treat them as short term trades, then establish swing trades after a higher low has been established so that you can place a logical stop - then once it starts trending it's much easier.  


The 'Pros' make their money by playing the trend, NOT by picking tops and bottoms, that's for the amateurs or novice traders, who end up getting stopped out 10 - 20 times before catching a top or bottom and by the time they finally catch it, they are an emotional mess, plus their accounts are decimated - that's why we teach to avoid that mess.


Anyway I got long winded there, otherwise for GDX, note my 60 min chart, there is an uptrend line from the lows, yesterday it was defended and once again today on the pullback GDX is retesting this trendline - let's see if it holds


Remember there is a lot of market moving news: we have the FOMC later today, the ECB tomorrow, and the big Jobs report on Friday


take care and good trading!


Matthew Frailey


Short term market comments - bear wedge patterns

Hello everyone, as you know I haven't posted any new comments since Monday, when I posted details of our powerful S&P 500 mechanical systems, you should check it out if you want a system that tells you when to buy and sell.

Back to the market: as you know the market has basically tested its all time highs once again.  However in the short term I'm watching these intra day charts on the S&P 500, the 30 and 60 min charts appear to have bear wedge patterns (see the first two attached charts), this is what I'm watching closely in the short term should the market decide to start a decent pullback.  The 3rd chart is a 2 hr SPX chart, longer term support is the uptrend line from the November lows.

Otherwise as you know there is a TON of potential market moving news today and the rest of the week.  We have the FOMC meeting later today, tomorrow we have the ECB and there are rumors that Europe may cut rates.  Plus we have the big Jobs Report on Friday.

Let's see how the Market Gods allow this to play out!