Here's the BPT MA deluxe MA, which is really just a fancy name for a moving average set that has tons and tons of settings. It allows you to plot two MA's like at 20 and 50 or 50, 200 or whatever, and it also has 8 different moving average types that you can choose from (Simple, Exponential, Weighted, Triangle, Adaptive, Hull Weighted, Hull Expontial, and Hull Modified). we can also plot just one MA and turn off the second (which is what I show in the sample charts). It also slows the color of the slope of the MA (green when the slope is up and red when the slope is negative).
The last custom setting it has is a whipsaw factor. You've all seen my use the BPT confirmation method where you need a second candle to confirm the first candle of an indicator change, I've shown this with various moving averages, MACD crosses, RSI above or below 50%, stochastics above or below 50%. However I added a whipsaw confirmation method to this MA that only allows the slope to change color if it is confirmed by a second color - this turns it into more of a trending indicator. I've attached some images below of daily and monthly S&P 500 charts. The setting that I'm using is a 34 length exponential modified MA (our #8 MA) with the whipsaw confirmation turned on, as you can see it's done a great job at catching most of the trends.
For BPT members who have Tradestation I'm going to give you this indicator and a workspace for free so that you can play around with different settings and follow it on your own!
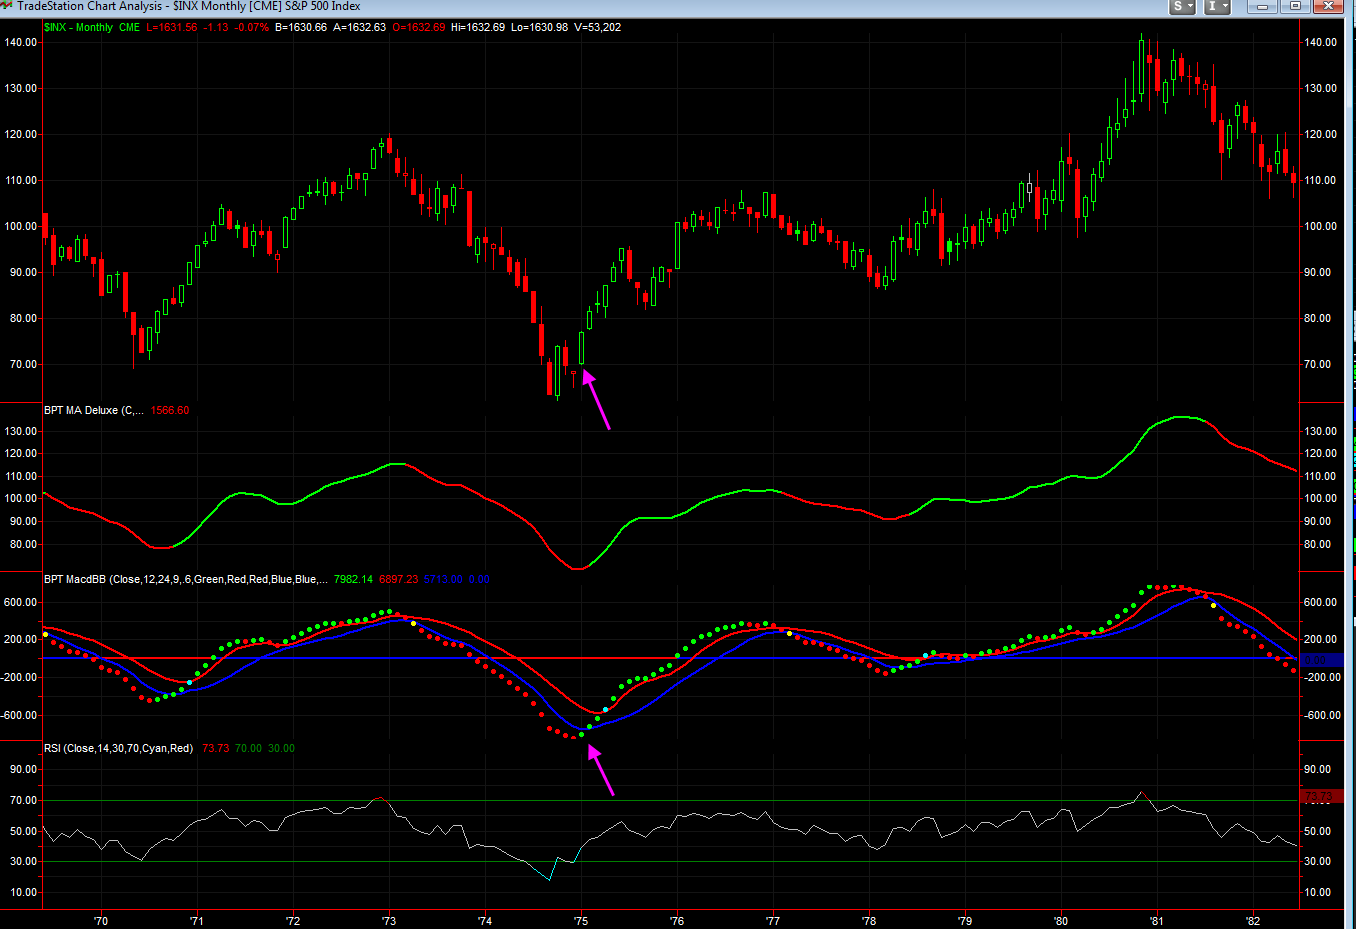
Again note that even though the indicator appears to follow trend very well, I still don't like to use it on its own, I use it as a tool with other things and analysis. For example on the monthly chart, I've found that whenever the RSI is oversold (which is a rare event on monthly charts), it's best to enter a long earlier than wanting for the MA to turn green - I've found taking the first MACD/BB green dot gets you in early (but only doing this when the monthly RSI was in a deeply oversold condition below 30%). The first three charts show monthly S&P 500 charts while the last 2 charts show daily S&P charts, one recent and while from the past.
On the daily charts as you can see it's been green since mid November so has caught this whole move.
**Click Here** to watch a detailed video of how this indicator works and how to use it
I will be giving this indicator to all BPT members for free who have a Tradestation account. However it's only for BPT members not free trial members (so sign up) if you want it.


No comments:
Post a Comment