Here's a follow up to the Unemployment chart that I did yesterday, LOL I found out that Stockcharts.com already has a lot of this data already, therefore I created some extra charts for us with indicators of major economic data:
The first chart shows the unemployment rate plotted with RSI, MACD, and Stochastics. Obviously MACD crosses can give nice signals as well as divergences that show in the RSI and MACD show major turning points such as in 2001 and 2007. The MACD has a negative cross in 2010 and since that time the unemployment rate has fallen.
The second chart is a plot of the U.S. GDP going back to 1980, obviously it's been uptrending since that time, however those of you who are ultra bears, notice the negative divergence that has been forming since 2008 i.e. the MACD is lagging GDX and forming a lower high. Perhaps this will eventually play out years later with a pullback in GDP and a contraction of the US Economy! However please realize this is a monthly chart so it may take a long time before it manifests. I also added the 4 length length ROC indicator, the zero level appears to be important long term.
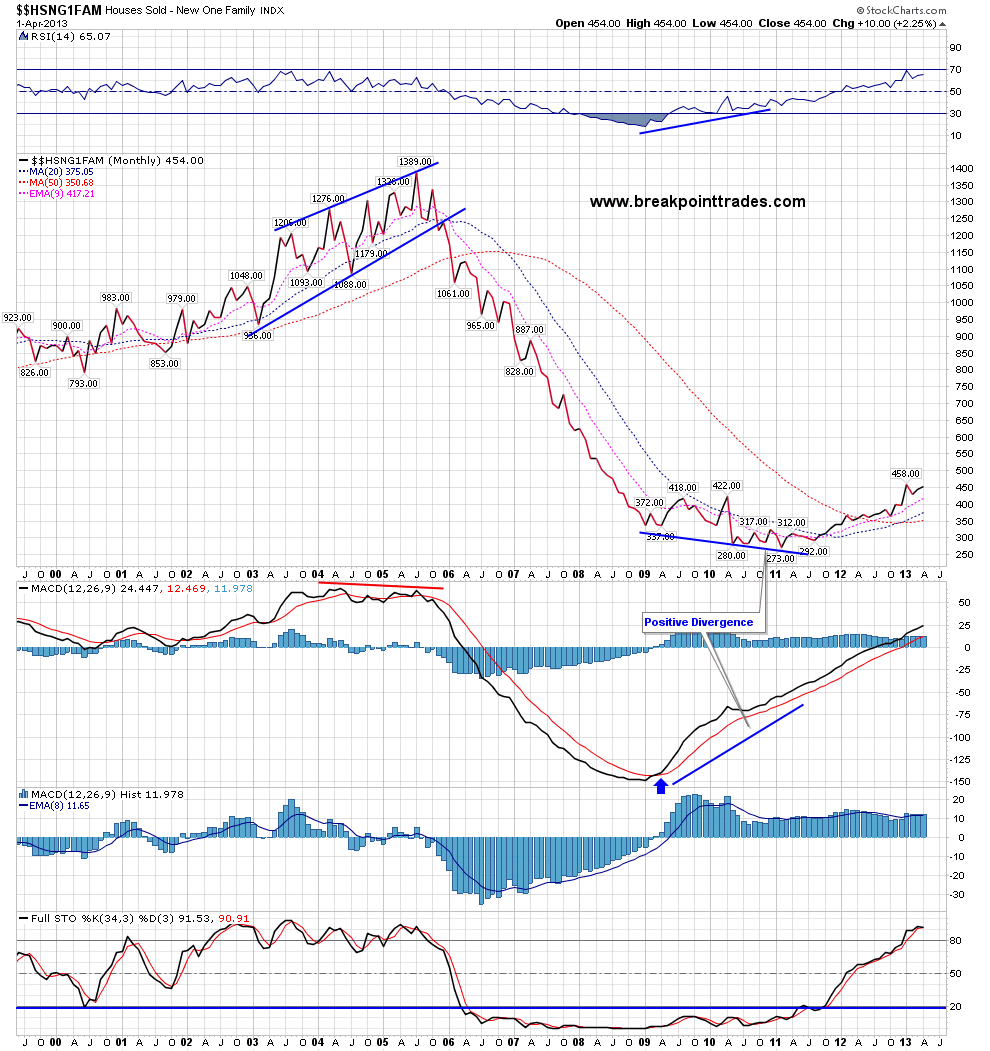
The third chart shows the new family houses sold - first off notice the negative divergence in the 2005/2006 time frame via the MACD and RSI indicators that logically ended the housing bubble as well as the bear wedge that was in place.
Also recently as base had formed with positive divergence between 2009 to 2012 which has lead to this somewhat what rebound in housing since last early last year
The 4th chart shows the Housing Starts and once again you see the same things as the Houses Sold chart, you see clear negative divergences and topping patterns at the end of the housing bubble in late 2005 that foretold the end of the housing bubble, and likewise you see some bottoming action that resulted in a bounce .
The last chart shows the Case Shiller Home Price index, as you cans see prices have recovered somewhat from the positive divergence that was in place from 2009 - early 2012, however housing prices have a LONG way to go before ever getting back to old levels from 2006.
This has been a fun exercise - I love that we are able to analyze economic data using standard technical analysis indicators which we use for trading. I think this represents a new way to analyze economic data going forward.


No comments:
Post a Comment