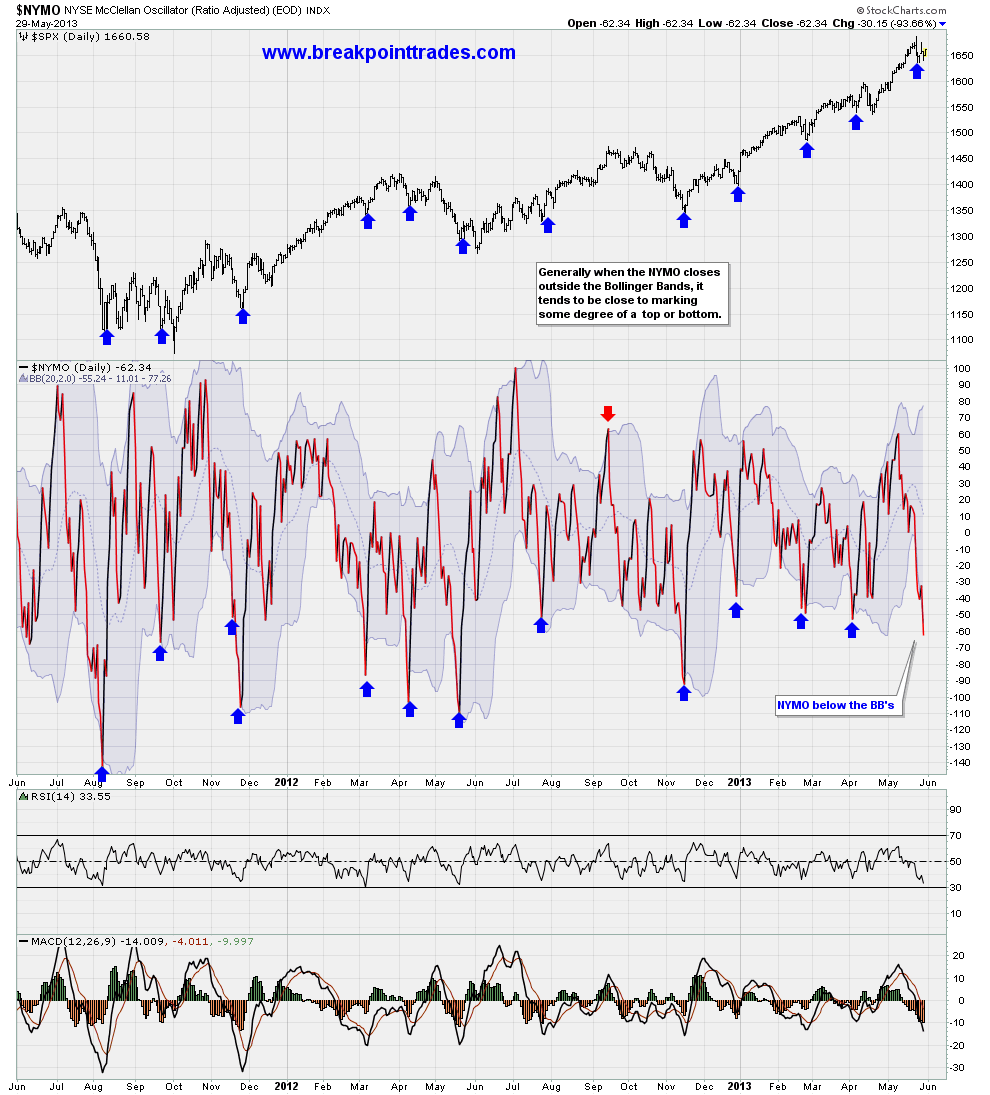
The market is up nicely today, why? Well take a look at one of our bottoming indicators, the NYMO plotted with Bollinger Bands along with the SPX plotted above for comparison. As you can see, every time the NYMO indicator has closed below its lower Bollinger Band, the market has bounced.
This is a powerful indicator for picking tradeable bottoms in the SPX and one of the many useful indicators available at Breakpoint Trades
No comments:
Post a Comment