Sunday, August 11, 2013

General Market Newsletter for Sunday August 11th 2013

Hello Everyone, here's our General Market newsletter for the weekend, the
market is at a major infection point here, so be on your toes!  Also our
25% coupon expires in 2 days, so take advantage of that! 

You can view the newsletter here.


Thursday, August 8, 2013

GDX chart

GDX - Chart Link Steve's daily that he made early last week for a tutorial, price tagged that trendline target and reversed


GDX - Chart Link - another daily


GDX - Chart Link - 15 min view, you had time to jump on it this morning


GDX - Chart Link - 60 min chart with Fibs, bounce tested the 130 MA, which is the same as the 20 day MA, and 50% Fib.  Steve added a potential wave count either ABC or a more bullish 5 wave, even under the ABC would make another high.


For those of you who want to hold - GDX has no business retracing all of today's gains, so you could use that as a stop, you dont' even want to see it retrace more than say 60% of today's candle - so these are some guidelines should you wish to give it some room vs just day trading

Saturday, August 3, 2013

Nice chart showing long term fib cycles

Nice chart showing long term fib cycles

Friday, August 2, 2013

The market has made the majority of its gains overnight on gaps - powerful statistics

The market gaps a lot and had little movement intra day - in fact the market has made the majority of its gains overnight on gaps.  I've shown these statistics a few years ago, however I thought it was time to post them again because they really illustrate this point well.


I wrote two very basically strategies in Tradestation to graphically illustrate this point:


One strategy simply buys the ETF SPY at the open and sells it on the close of the same day.


The other strategy simply buys the ETF SPY at the close and sells it on the open of the next day.


For the strategies I'm using $100K for each buy and I'm not counting commissions because these are not meant to be strategies that you actually trade - I'm simply showing the effect that gaps have had on the market over the last 18 years.


As you can see from the two profit curve charts below, the results are quite astounding, if you bought the SPY ETF every day on the open and sold it at the close of the same day, you lost money consistently every year!   Your $100K turned into about 60K losing about $40!.  Amazing that you actually lost money simply buying the open and selling the close.


The second chart shows what happens if you simply buy the SPY at the close and sell on the open of the next day - as you can see, your $100K turned into over $400K!!  Quite a difference!


So as you can see - if you recently thought to yourself, "man the market gaps all the time and seems to make most of its moves overnight" you are right - in fact the results are probably more shocking than you realize.  The public masses think that the market makes its gains during the day, but this is not the case.


Also guys - regarding the SPY Ver 2 and Pro systems - this is why those systems exit their long positions on the next day open vs that same day

Thursday, August 1, 2013

Updated Market Stats

Earlier this year in January I posted these market stats - one shows the effect of a strong January, this year the market closed up 5% for Jan, which boded well for the year with every year except for 1987 gained 20% or more after gaining 5% or more in January.  Then we had a very strong 1st quarter this year, which also boded well for the year as a whole (95% chance via the stats), by the way the market had a strong 1st quarter last year as well.  Currently the Dow is up 16% this year (SPX is up 19%).  Obviously the 3rd quarter isn't closed yet and we'll probably have some kind of pullback during the 3rd quarter - however historical stats still suggest the market will close the year up 10% more more, the one exception was 1987 where the market had a 23% correction in the 4th quarter, however ironically it still ended up 2% of the year because the first quarters were so strong

Monday, July 29, 2013

Here\'s our recent newsletters and a 25% Coupon!!

Hello everyone, I hope you had a nice weekend!


Here's our two weekend newsletters, enjoy.  Also please consider taking advantage of our 25% off coupon to our 6 month membership!


- Commodity Newsletter July 29th, 2013


- General Market Newsletter July 29th, 2013

Monday, July 22, 2013

Gold Stocks may have put in a decent bottom - let\'s take a look at the charts

Gold stocks have rallied off their June lows and may have finally put in a decent bottom after being the worst sector in the stock market for a year.  


The first chart shows a weekly chart of NEM, take a look a the RSI indicator at the top, notice how over the last 18 years it has rarely been oversold, and on the last low the RSI actually had positive divergence, which was something we haven't seen in 20 years.  Also notice the uptrend line from the 2001 lows, NEM is attempting to bounce off this area.  Now watch for a MACD cross bullish confirmation, it's now very close.  The send chart is another weekly chart while the 3rd is a daily chart showing a well-defined channel.


Chart number 4 shows a monthly chart of the XAU index - notice the long term trendline and RSI


Charts number 5 and 6 show weekly charts of the HUI Gold Bugs Index, notice the long term trendlines and RSI indicator.  The MACD also has an early bullish cross - the last time this occurred in 2008, the it did not cross back down until 2010

Sunday, July 21, 2013

Here's our VERY comprehensive weekend newsletters

I hope everyone had a new weekend!

Here's our two very comprehensive weekend newsletters

1. General Market Weekend Newsletter

2. Commodity Weekend Newsletter

Thursday, July 18, 2013

BPT MA follow up

So far so good - about 100 points gained on the 60 min SPX chart since the BPT MA flipped to green on 6/25, again don't expect it to be that good all the time - as we state before, this indicator catches trends well, and the market has trended - it's chop situations where it can whipsaw.


Otherwise notice the two low risk buy's on July 2nd and July 16th on the pullback - where you see it change to blue

Monday, July 15, 2013

Observation -SPX had 8 up candles in a row

As noted, the SPX has had 8 up candles in a row that all closed higher than they opened and higher than the previous day.  I looked back 20 years and I could only find one other instance of this from 2003 and the next day was a down day.  I found quite a few instances where 6 and 7 up candles where formed in a row, but only one other 8 day example.


Either way, very short term the market is getting stretched and due for a reversion to mean quick pullback even if it's only for one day

Sunday, July 14, 2013

BPT MA Deluxe coming for Ninja Trader

FYI - we are getting pretty close to converting the BPT MA Deluxe Indicator to Ninja Trader - probably early this week, I'll keep you posted - the charts here of course are not from Ninja Trader, they are from Tradestaion, again I'll follow up when we have something

Tuesday, July 9, 2013

Here\'s Our latest Newsletter

Hello everyone, regarding the recent market action, here's our latest comprehensive newsletter


CLICK HERE To see the Newsletter


Matthew Frailey

Monday, July 8, 2013

Long Term Mechanical System for SPX additional

I've completed the states if you shorted vs going to cash, here they are and a couple chart examples - system goes up to 400 times the original investment vs 168 via non short, that's just crazy!  $100K invested into the S&P 500 from Nov 1962 until present would have turned into $2.6 million, whereas that same $100K would have turned into $40 million via this system.


Obviously the current long from 3/31/09 is still open, so we'll see where this trade ends, at 1559 days into the trade from 3/31/09, it's still still been in this trade less than the average 1702 days that the system remained in long trades in the past.  


Average time in long trade is 1702 days, average time in short trade is 396 days

Sunday, July 7, 2013

Here's a new long term 401K system using the BPT MA and other indcators

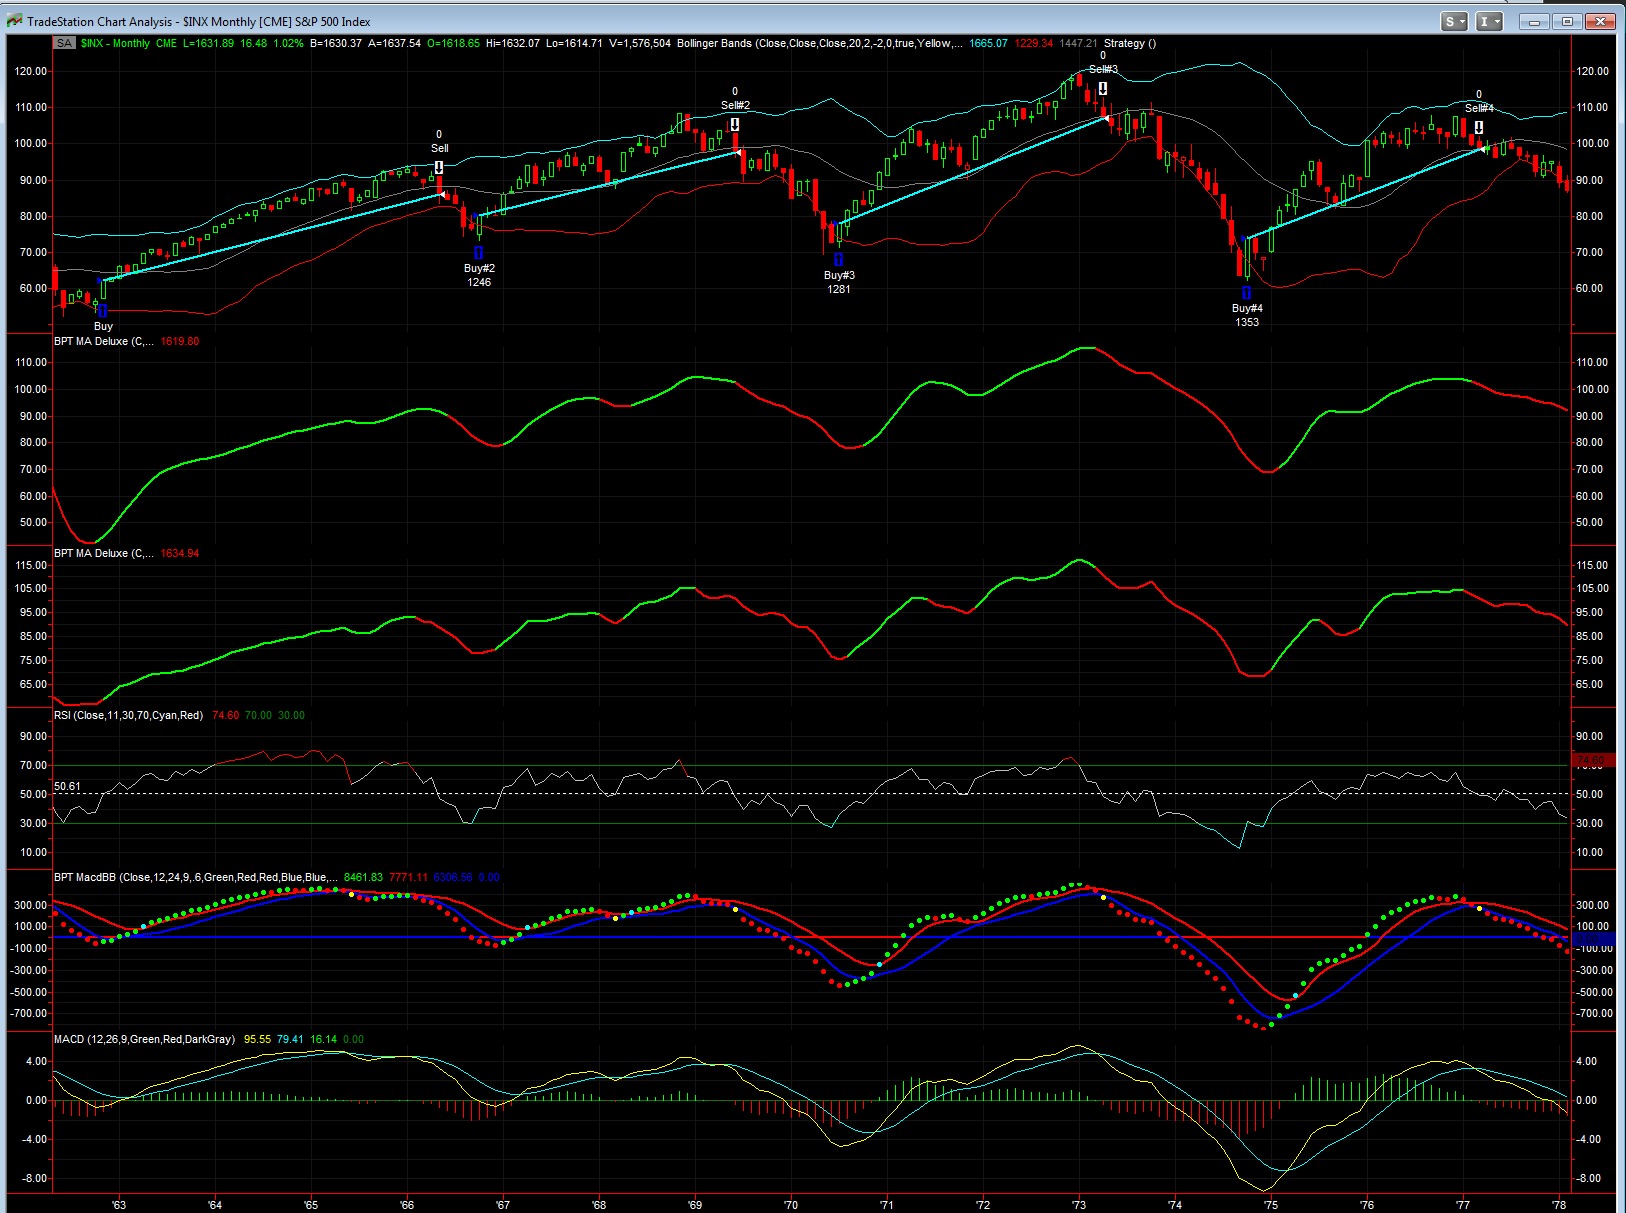
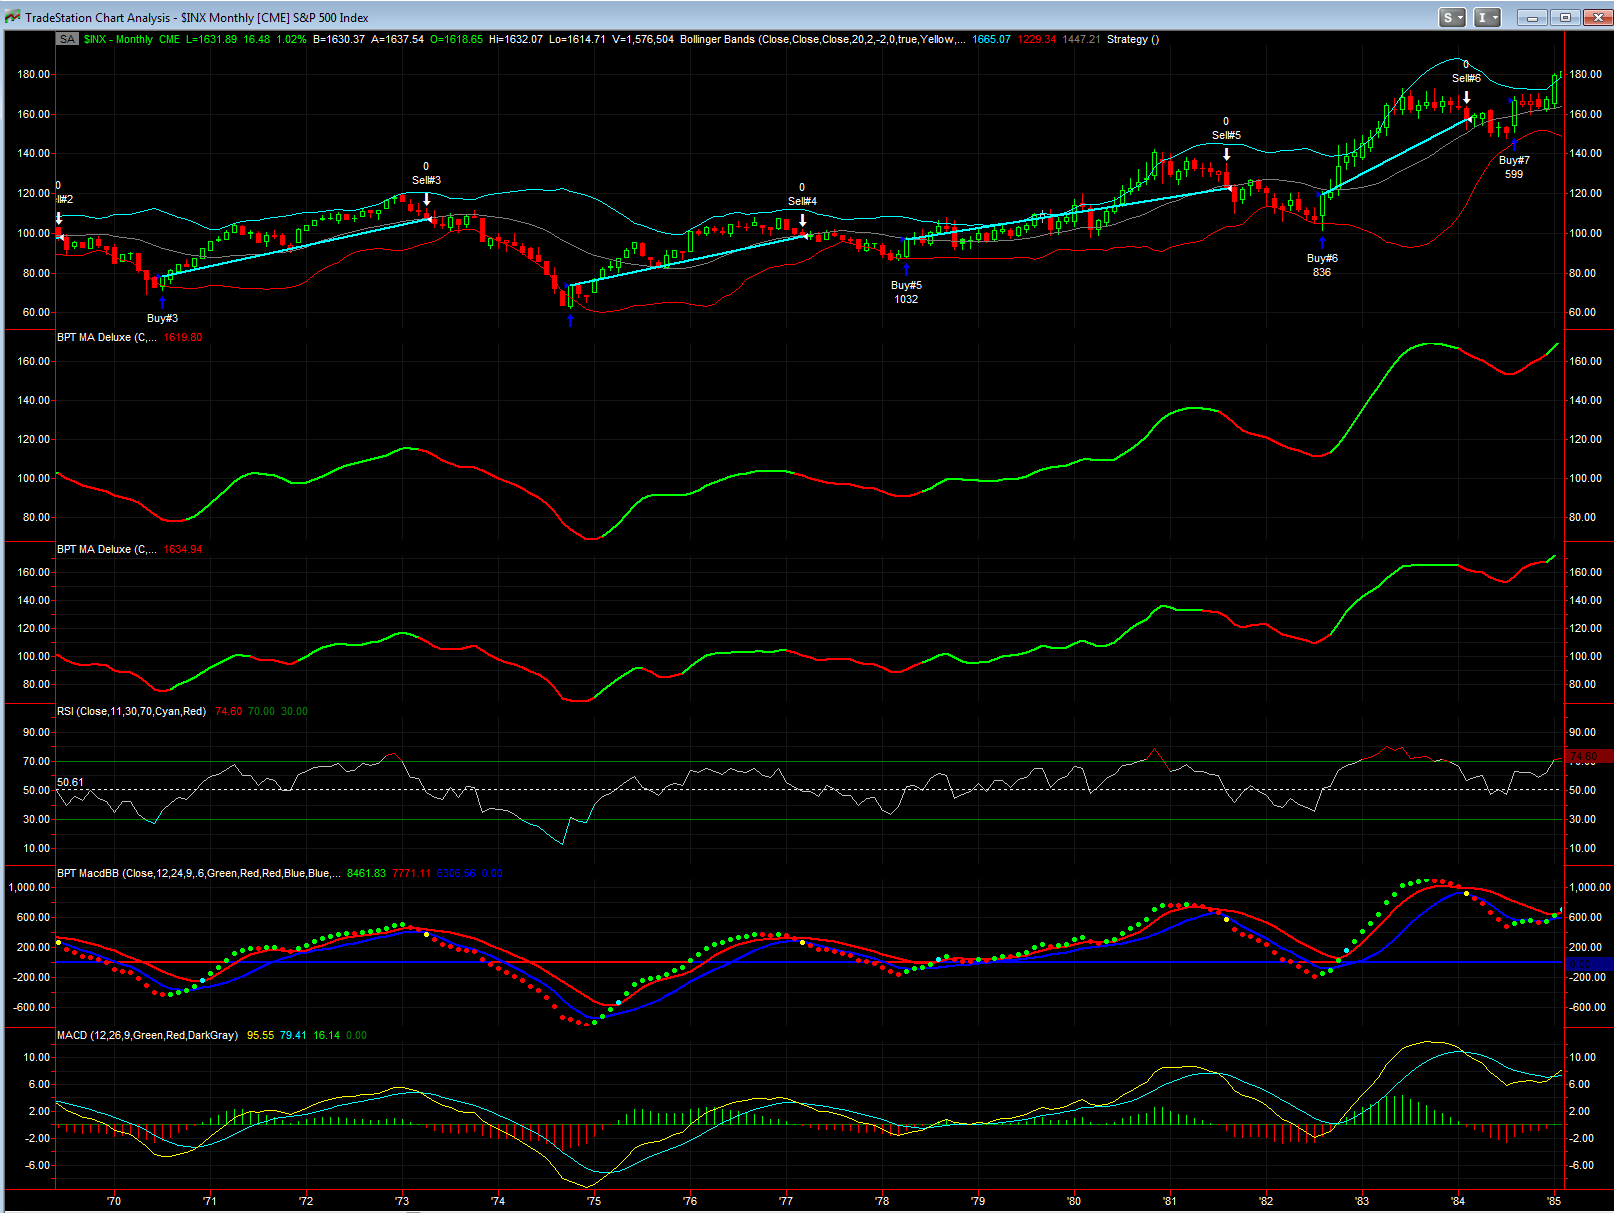
Here's a new long term 401K system, which uses a monthly chart along with the BPT MA Deluxe as well as other indicators and rules to catch long term trends in the market, while keeping you out of bear markets - it destroys buy and hold.  


CLICK HERE to watch a short 5 min video overview


Obviously system system is what I call a paint dry system because it is designed to stay in uptrend bull markets for as long as possible, but also stay out of bear markets, so it is not a system that most of you would be interested in, however family or friends who are not traders it would be ideal for.


For example my neighbor who seemingly ever week tells me about how his managed IRA account at AG Edwards has grown so much this year, I constantly tell him, that's great Pat, but you are only doing well because your broker simply has you invested in the market, when the market enters a bear market in the future he won't get you out, you will ride it all the way down - this system allows you to stay in the bull markets for years, but be out for bear markets so that you can buy back in at much lower prices, thus beating 99% of the masses.


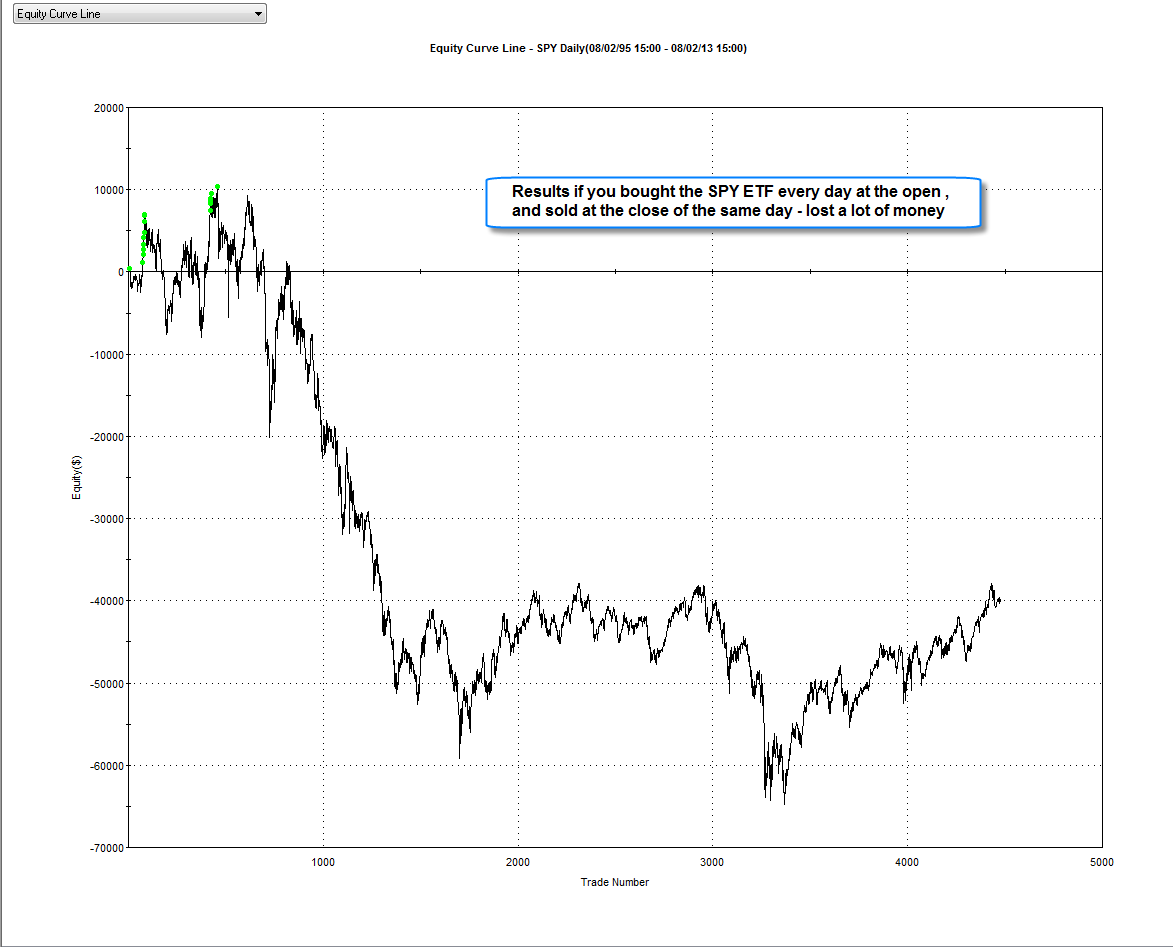
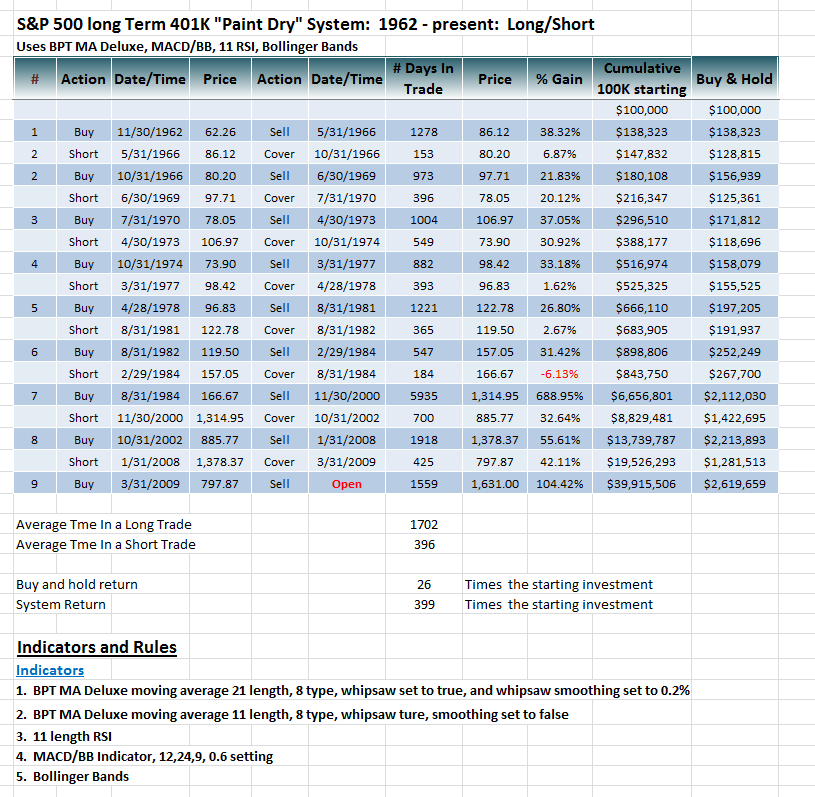
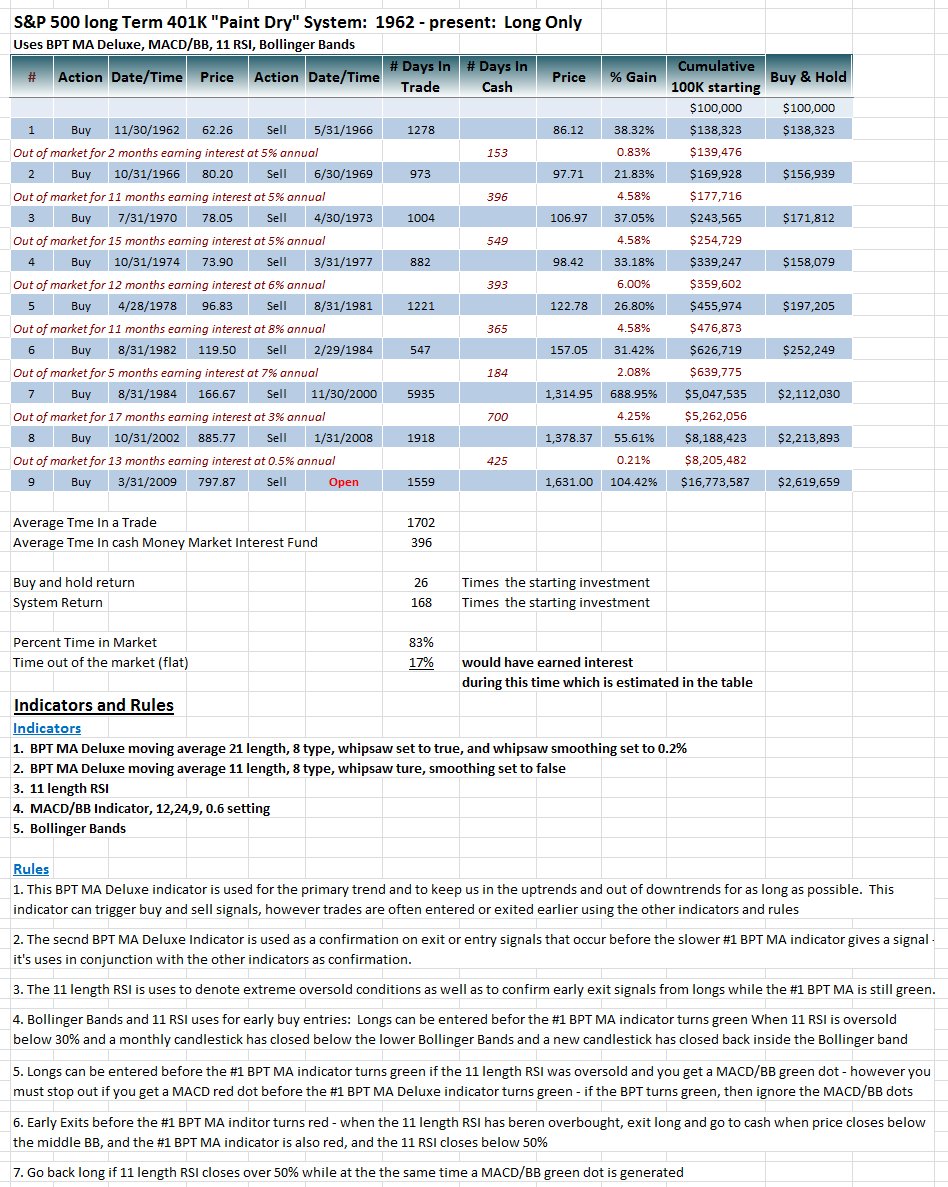
As you can see the average trade length is about 1700 days! The average time the system is in cash or money market is about 400 days (these are the bear market periods).  I currently have the system as long only because with the clientele in mind like my neighbor or other friends who have 401K plans tied to the market, they are not allowed to short or would not short or don't even know what a short is, that's why I simply have the system exit the market and go to a cash money market fund where interest can be gained whenever an exit signal is generated.  


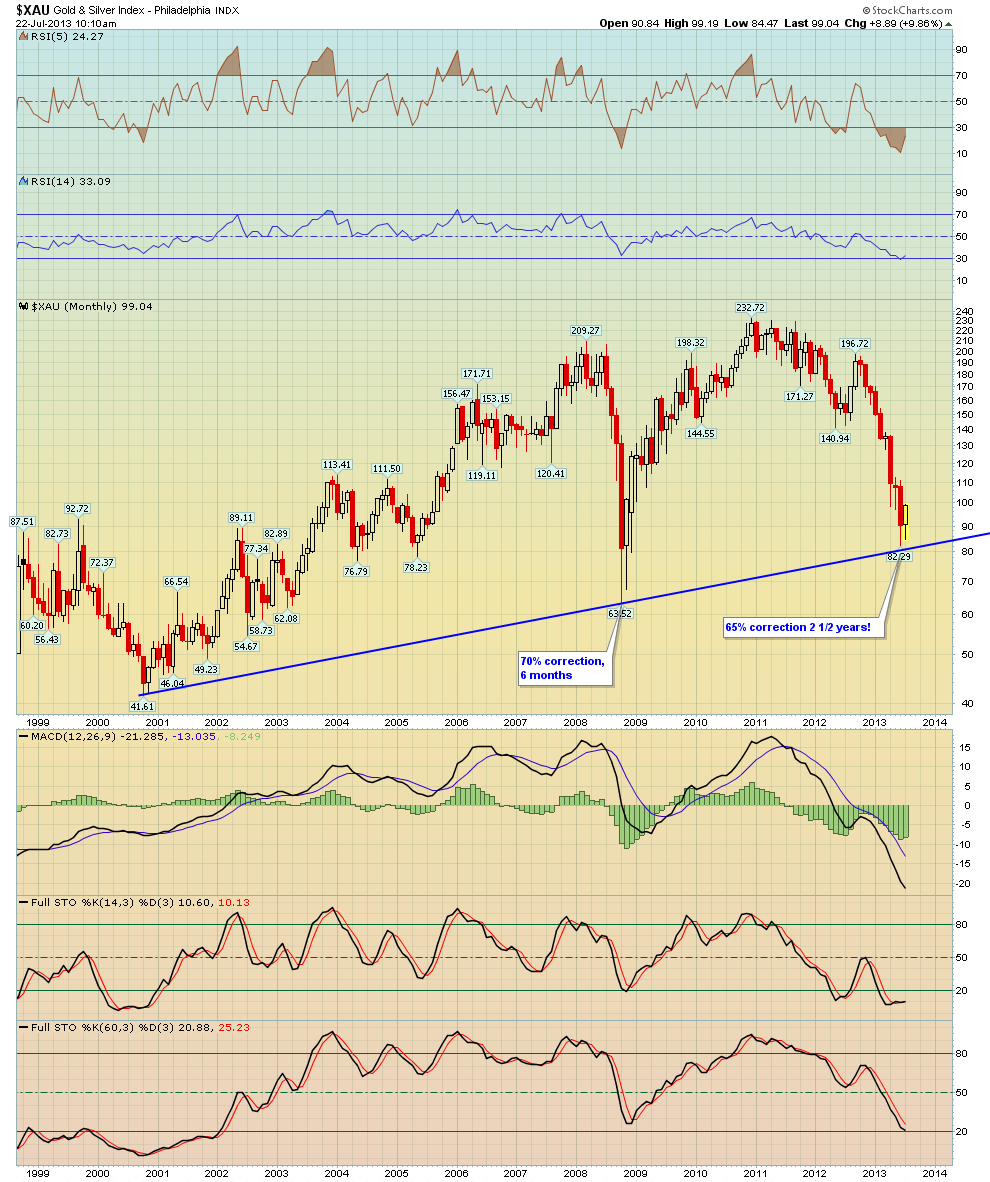
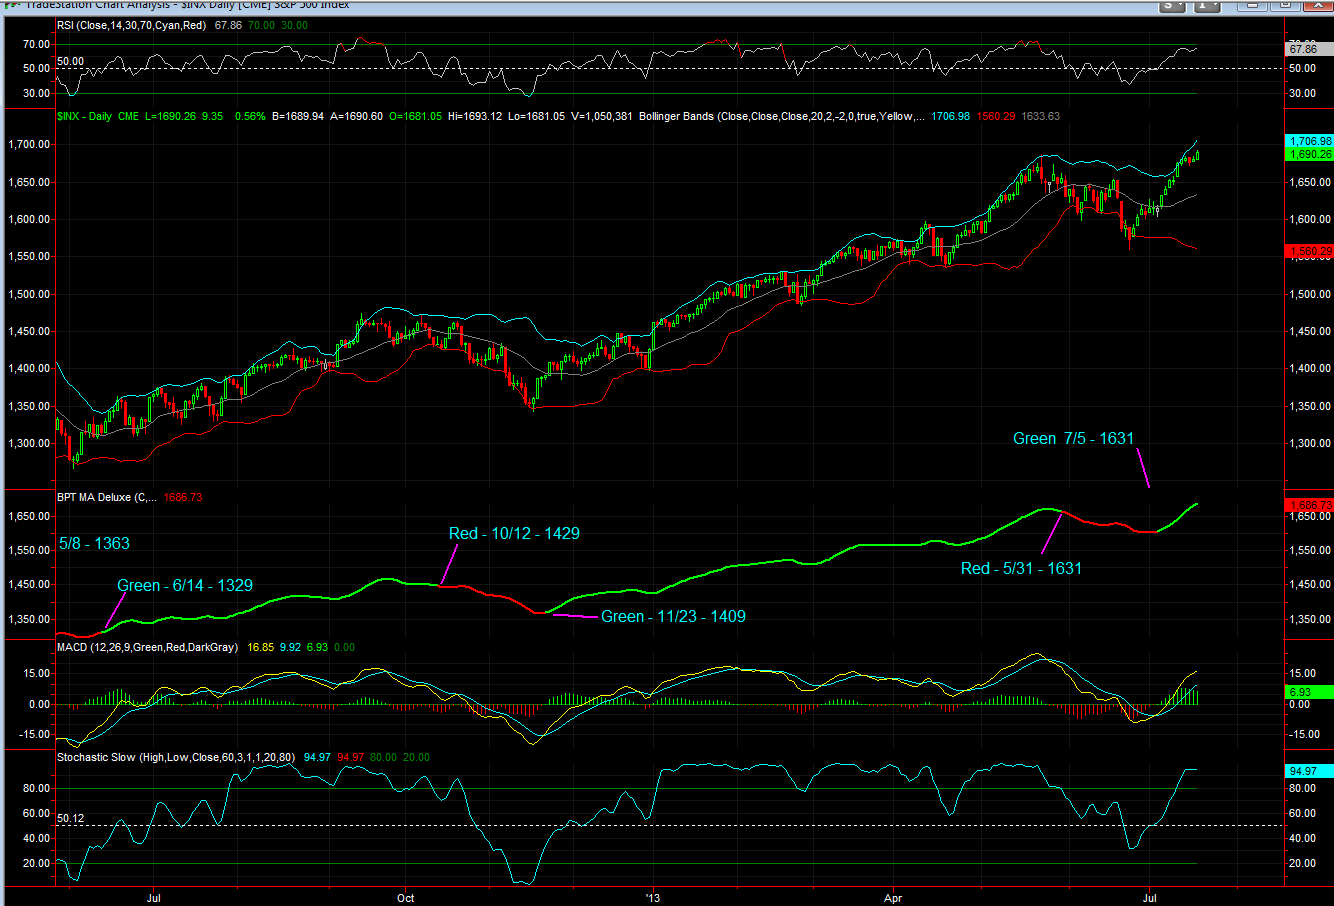
The statistics below show the returns, however if you would like I can also show the stats assuming that you shorted vs going to a money market fund- however I did include interest that would be gained while in a money market cash fund by looking at historical rates for the time periods where the system was out of the market.  Also regarding the BPT MA Deluxe indicator - as I show here, while it's a great indicator, as I've been telling all of you, it's MUCH better to use it as a tool with other indicators and analysis, vs trying to use it by itself. 


I also include the various indicators and rules to the system as well as chart examples.  I will eventually place this on the website in the long term tools and provide a Tradestation workspace