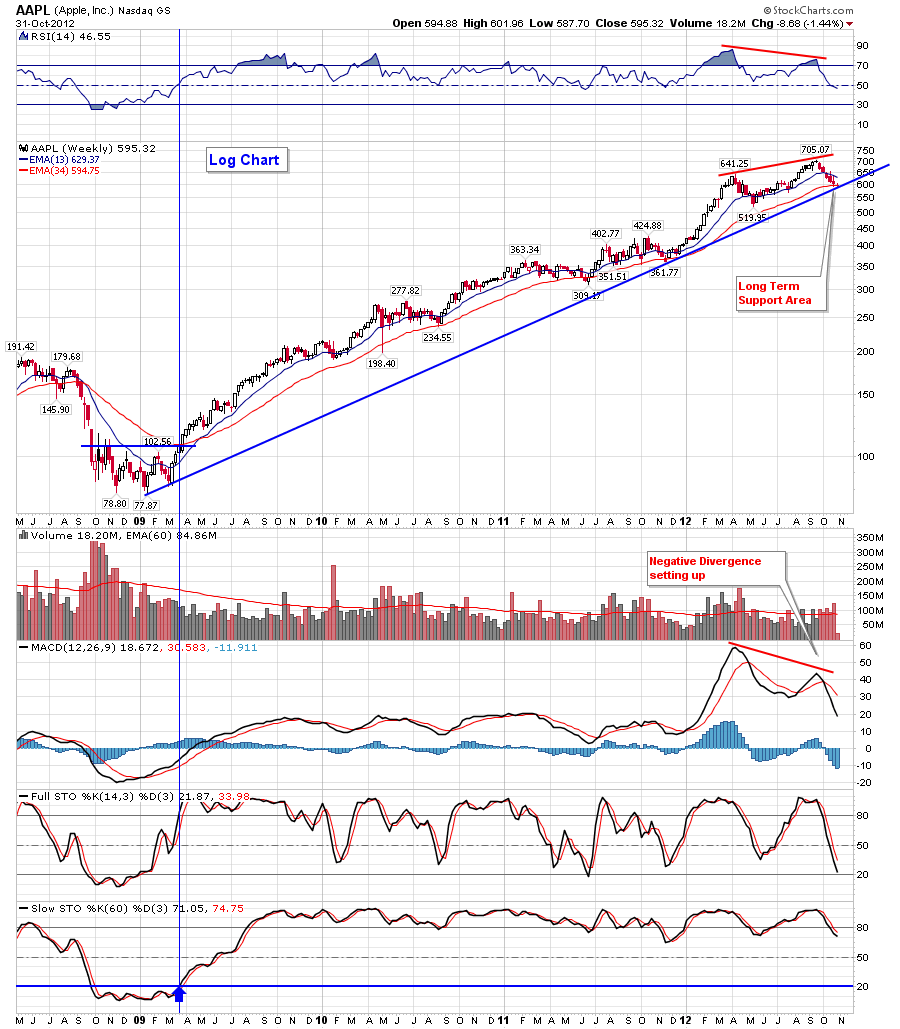
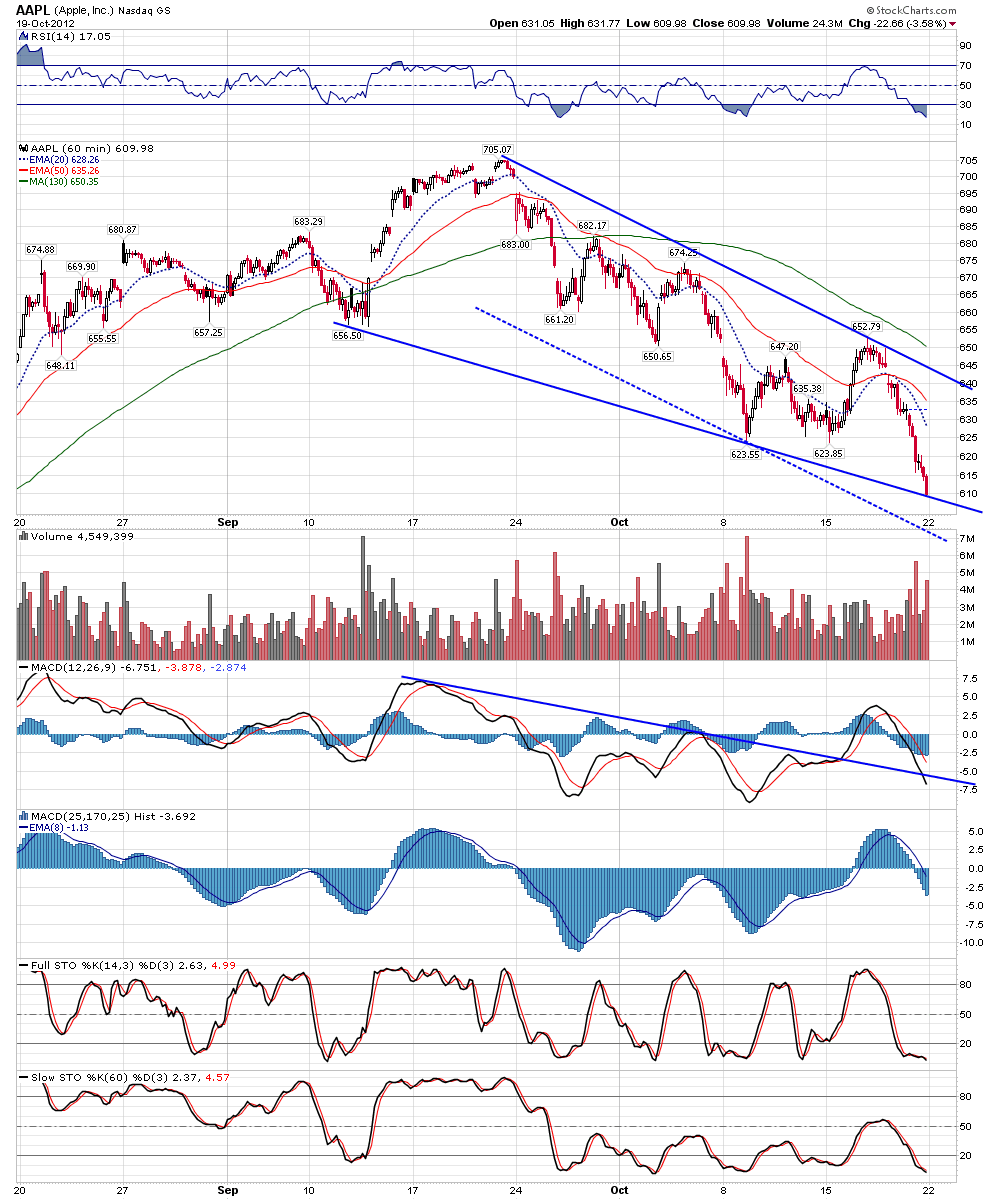
Here's a weekly and a daily chart of AAPL, note that AAPL is near a weekly uptrend line and the 200 day MA is very close.
Wednesday, October 31, 2012


Sunday, October 28, 2012
There\'s a Moon cycle tomorrow
$SPX - Chart Link - Moon cycle tomorrow, lately the market has been reacting to the moon cycles, will this moon cycle market a temporary bottom??
Otherwise remember the RSI 2 system went long an initial entry of 30% last week. There are a total of 4 entries, the system will scale in to the other trades ONLY on lower prices below the first entry.

Thursday, October 25, 2012
BPT EMA RSI 2 System
Yesterday, 10/24/12, Matt sent out an alert that the BPT EMA RSI 2 System entered an initial 30% long position on the close.
This
notification is to advise that the system will enter in a second long
entry of 30% (bringing the position to a total of 60%) if the S&P
500 closes below yesterday's close of 1408.75.
Wednesday, October 24, 2012
just to show for clarification - 1st entry of 30% ...
just to show for clarification - 1st entry of 30% was taken

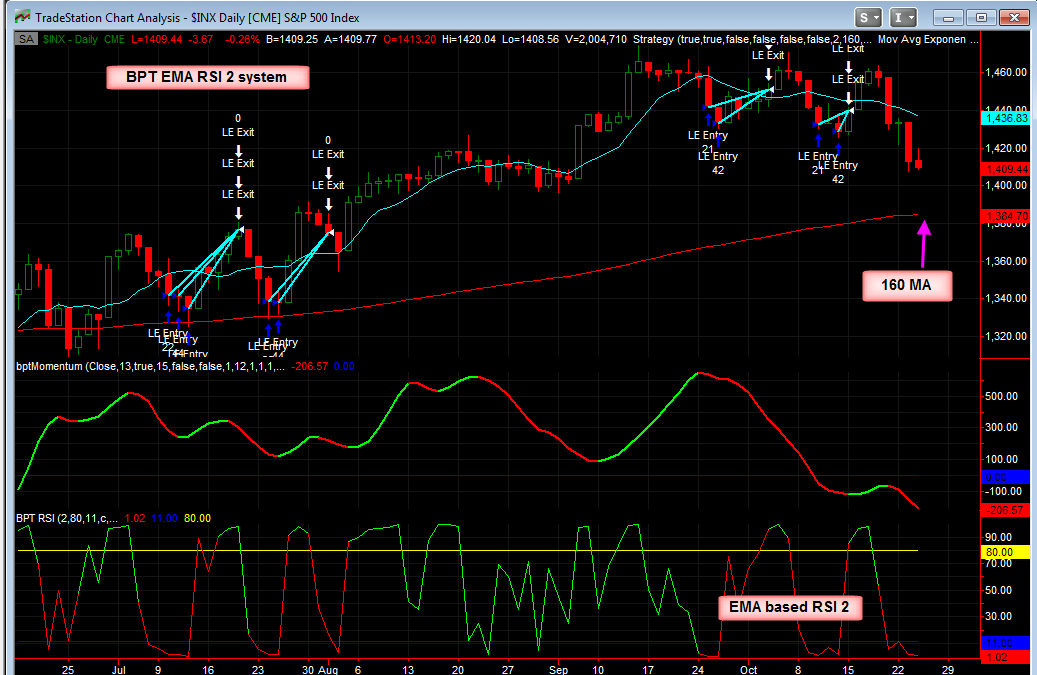
BPT EMA RSI 2 system
The EMA based RSI 2 system that I discussed before will be taking an initial long position today of 30% if the SPX closes negative or even flat. The system has a total of 4 potential scale ins if better prices are met (30%, 30%, 20%, 20%). Most of the trades end up having 2 entries. Currently the S&P 500 is down 5 points, again the closing price is the key.
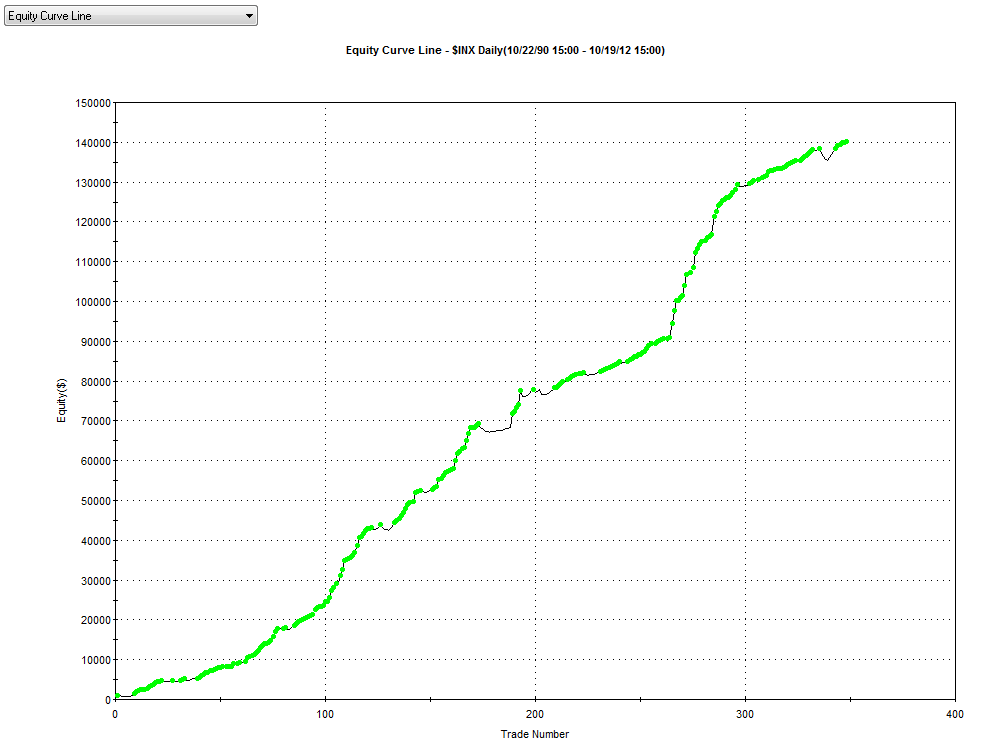
Key statistics - 21 years
349 trades
84% winning trades
Profit factor of 9.9
Average time in trade is about 8 days
**CLick Here** to see a full statistics report including a list of all the trades. NOTE** this must be opened in Internet Explorer ONLY not Chrome or Firefox
-----
Modified RSI 2 system -uses an EMA based RSI 2:
Longs:
When price is above the 160 SMA, go long when the RSI 2 falls below 10% for 2 days in a row.
Exit Long when modified RSI closes back above 80%
Exception (I use a trending indicator to hold trades for longer periods of time under certain conditions).
Shorts:
When price is below the 160 SMA, go short when the RSI 2 closes above 90% for 2 days in a row.
Exit short when modified RSI closes back below 40%.
Exception (I use a trending indicator to hold trades for longer periods of time under certain conditions).
**Note** For all the statistics below, all trades were 100K for simplicity purposes with no compounding. Additionally, this is presented for informational purposes only, do what you feel is right and always use proper money management


Tuesday, October 23, 2012
Nasdaq 60 min chart market comments
Here's a 60 min chart of the Nasdaq, the tech sector has been much weaker than the Dow and S&P 500 and has been a major concern of ours. This 60 min chart of the Nasdaq recent broke down from a H&S topping pattern, if this pattern plays out to fruition (potential price target would be the pattern measurement shown via the shaded area), then this market has more downside to go.
Also as a follow up to my RSI 2 post below, none of the RSI 2 systems went long yesterday, however if today ends up being a strong down day, then the RSI 2 systems will go long and take a 1st entry (30%) stake, the system can enter a total of 4 scales ins, 30%, 20%, 20%, 30%.
If you would like to receive more timely updates to these mechanical systems, please sign up to our free newsletter by filling out the box on the upper left hand side, or sign up for a membership to Breakpoint trades. Currently our 6 month membership is 50% cheaper per month than our standard monthly rate, it's the best deal by far.

Monday, October 22, 2012
RSI 2 S&P 500 mechanical systems update
Hello everyone, here's a follow up to various RSI 2 reversion to the mean S&P 500 mechanical systems that I've discussed at various times throughout the year. With he market sell off last week, we need to keep on these systems because if the market sells off again this week, they will go long - I will of course alert you if they do, this is just an early heads up.
**Click here to view my newsletter** with tons of chart examples and statistics.
Friday, October 19, 2012
AAPL charts
Here's a slew of AAPL charts:
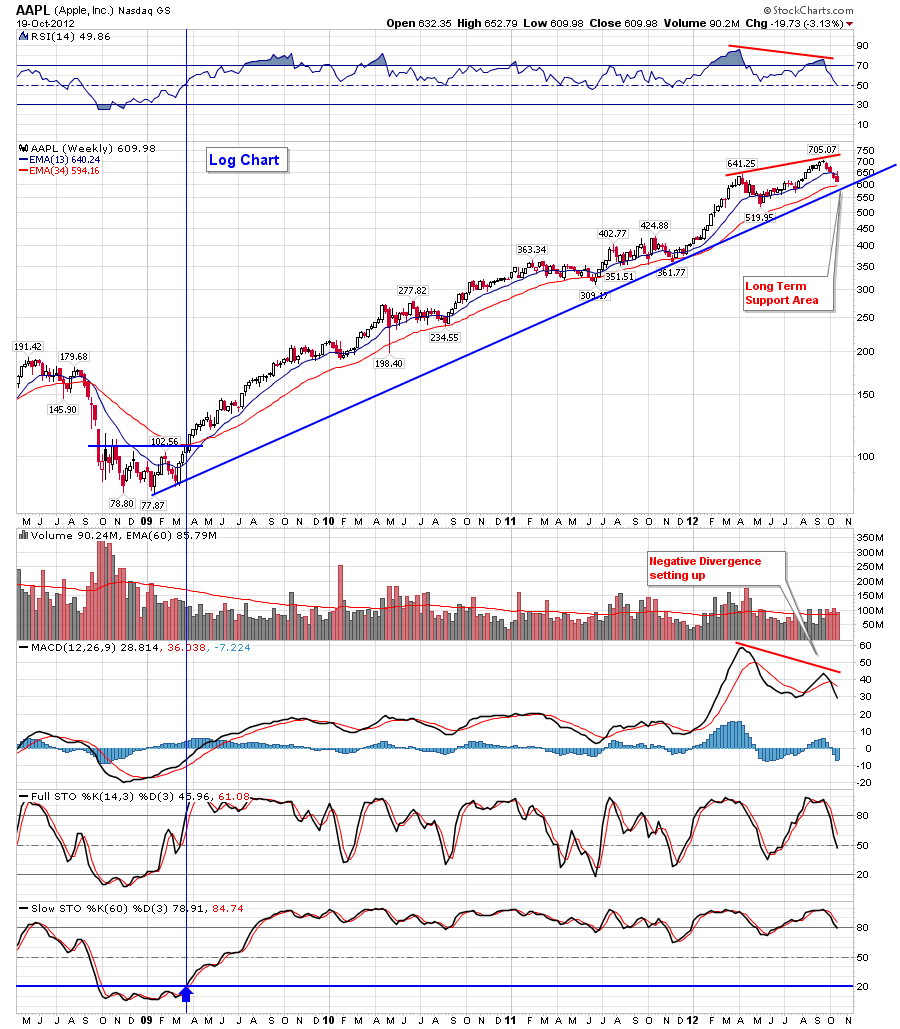
AAPL - Chart Link - weekly chart 1, this is a logarithmic chart, uptrend line approaching around the 600 or high 500's range.
AAPL - Chart Link - weekly linear chart, long long term support much lower below, but no reason to discuss this trendline at this time, though eventually I bet it will test it.
AAPL - Chart Link - daily chart shown weeks ago, had a little H&S top, obviously played out, then broke an uptrend line. The 200 day MA is below and might be a target over time. Or short term might get a bounce back to back test the broken uptrend line.
AAPL - Chart Link - daily wave count that I showed months ago, clearly that wave 5 played out.
AAPL - Chart Link - 60 min view
AAPL - Chart Link - 15 min view, still no positive divergence.



AAPL weekly chart comments
Here's a weekly chart of AAPL, as you know it has been very weak lately as we have been covering. the weekly chart shows a long term uptrend line approaching soon near the 600 - to high 500's. Will that area provide some support?? You can see the clear negative divergence that was present on the MACD

Nasdaq comments
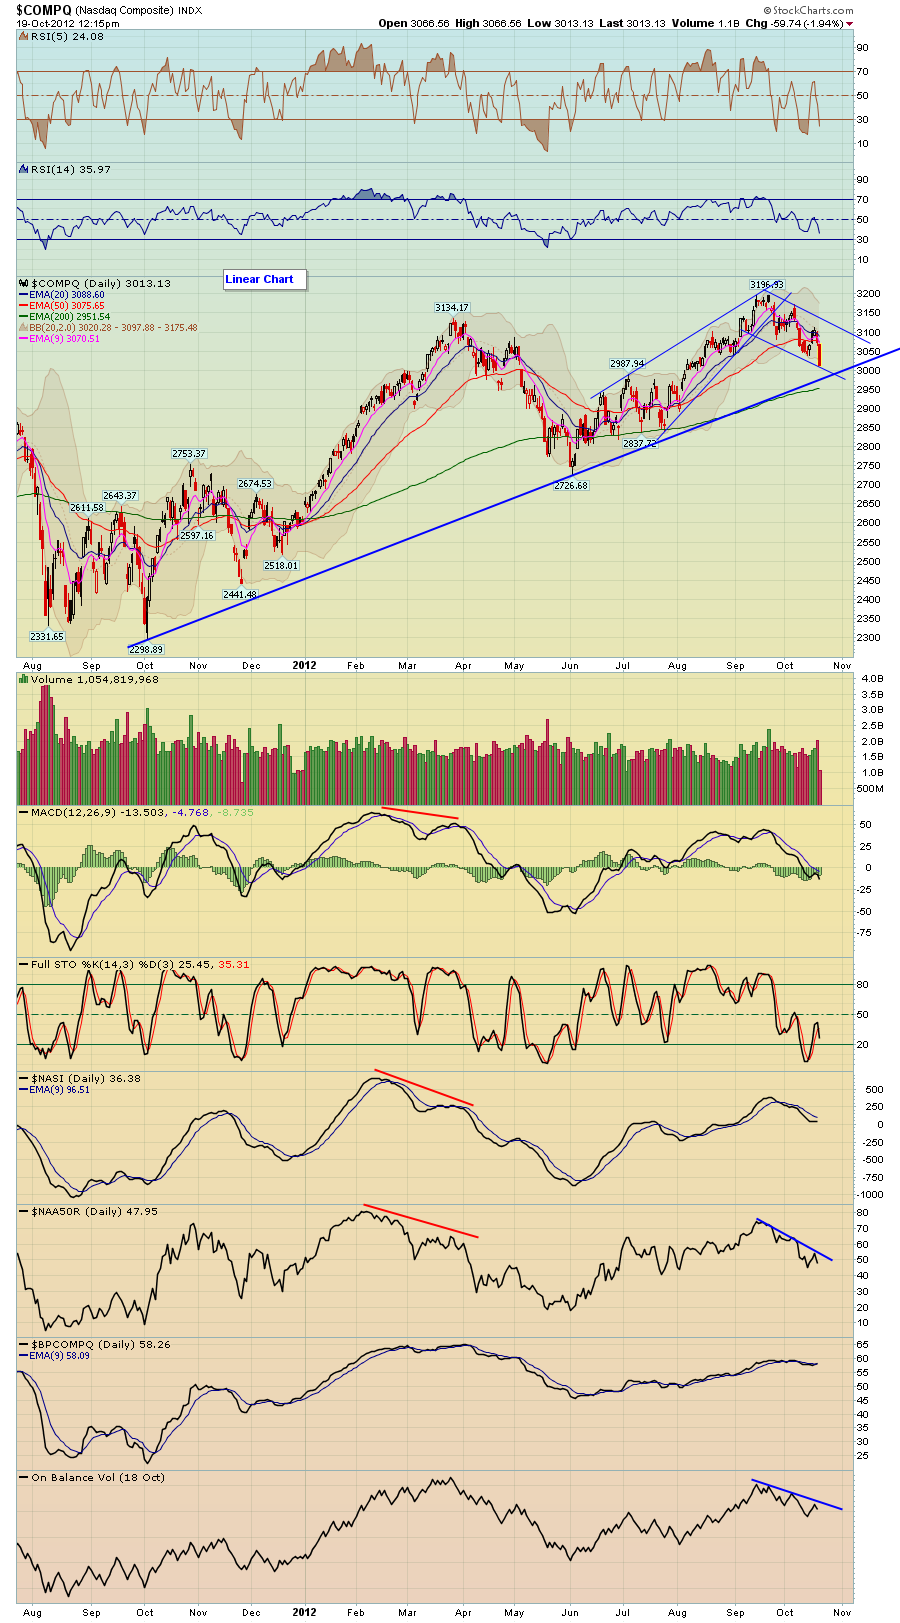
$COMPQ - Chart Link - weekly chart, no doubt arguing that the weekly chart is ugly with negative divergence and a bear wedge. Though honestly one more eventual push up within the wedge would make the pattern much more complete with 5 waves.
$COMPQ - Chart Link - There is an uptrend line below and of course the 200 day MA
we'll see...

Wednesday, October 17, 2012
Market Newsletter and Trade ideas
Hello everyone, here's our most recent market analysis newsletter
Click here to view the newsletter - make sure you have your audio on
good trading,
Matthew Frailey
SPX daily and SPY follow up to Oct 10th post
Last week on Oct 10th, I posted a daily S&P 500 chart, showing major support around the 1425 area, as you can see the market has bounced nicely off support, provided a low risk long entry
Here's the link to that post


Tuesday, October 16, 2012
Another RSI 2 strategy
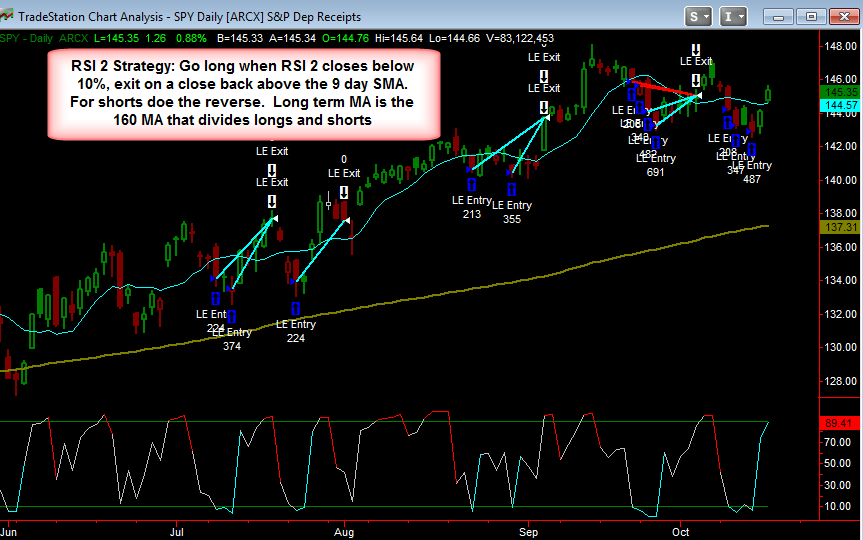
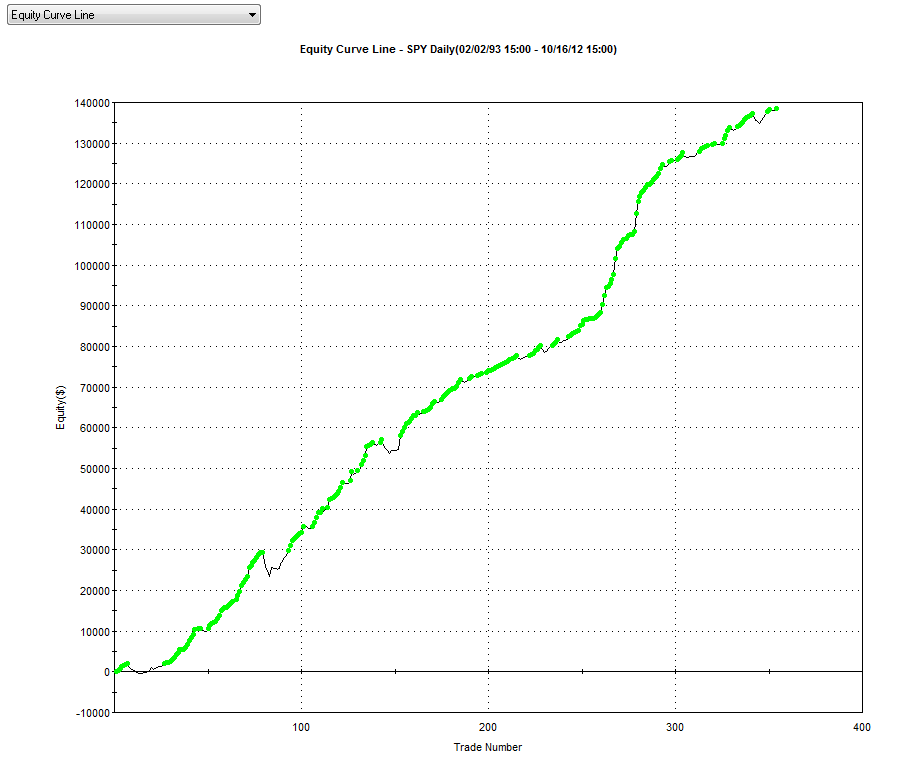
Here's another RSI 2 strategy, it went long on the market pullback last week as well. This one is slightly different than the previous one that I posted. This one uses just a standard RSI 2 (not EMA based). Also this one exits on a close back above the 9 day SMA (vs the RSI 2 getting overbought). Price needs to be above the 162 MA for longs and below the 162 for shorts. Like the last system, this one also scales in for a total of 4 parts: 30%, 20%, 20%, 30%. Each successive scale in needs to be at a lower price than the previous one.
Since price is clearly going to close well above the 9 day SMA today, therefore the system will exit today on the close
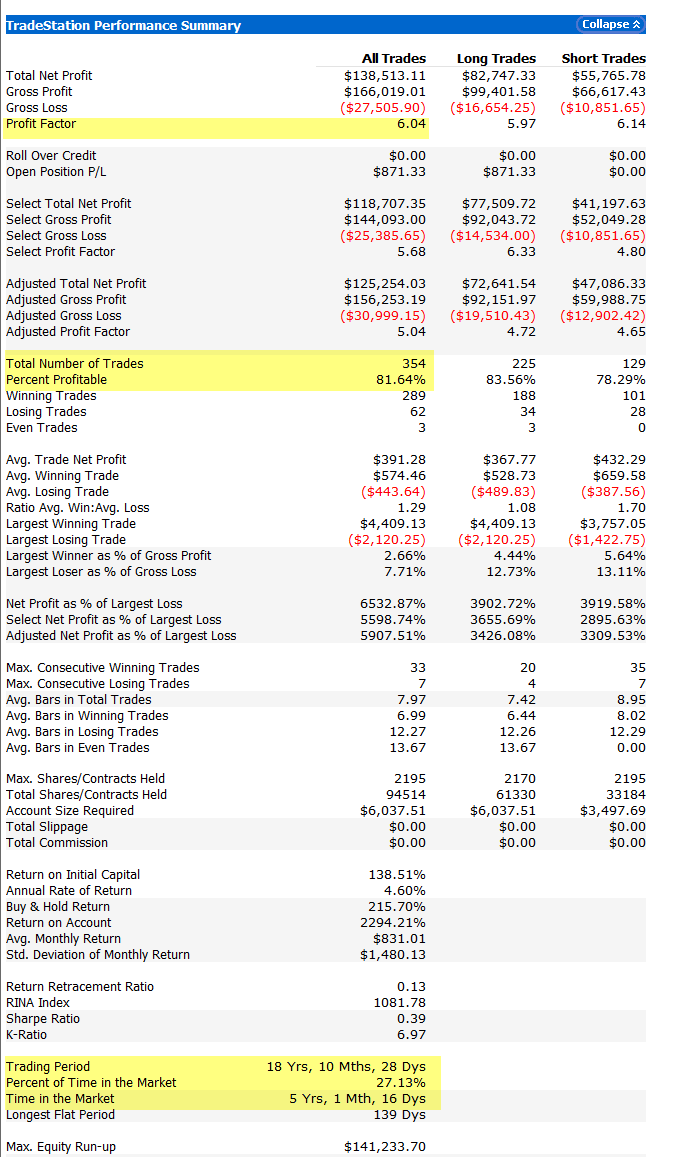
The statistics are decent at a profit factor of 6, 354 trades over 18 years, and 81.6% winning trades.
Monday, October 15, 2012



Subscribe to:
Posts (Atom)