Here's a slew of AAPL charts:
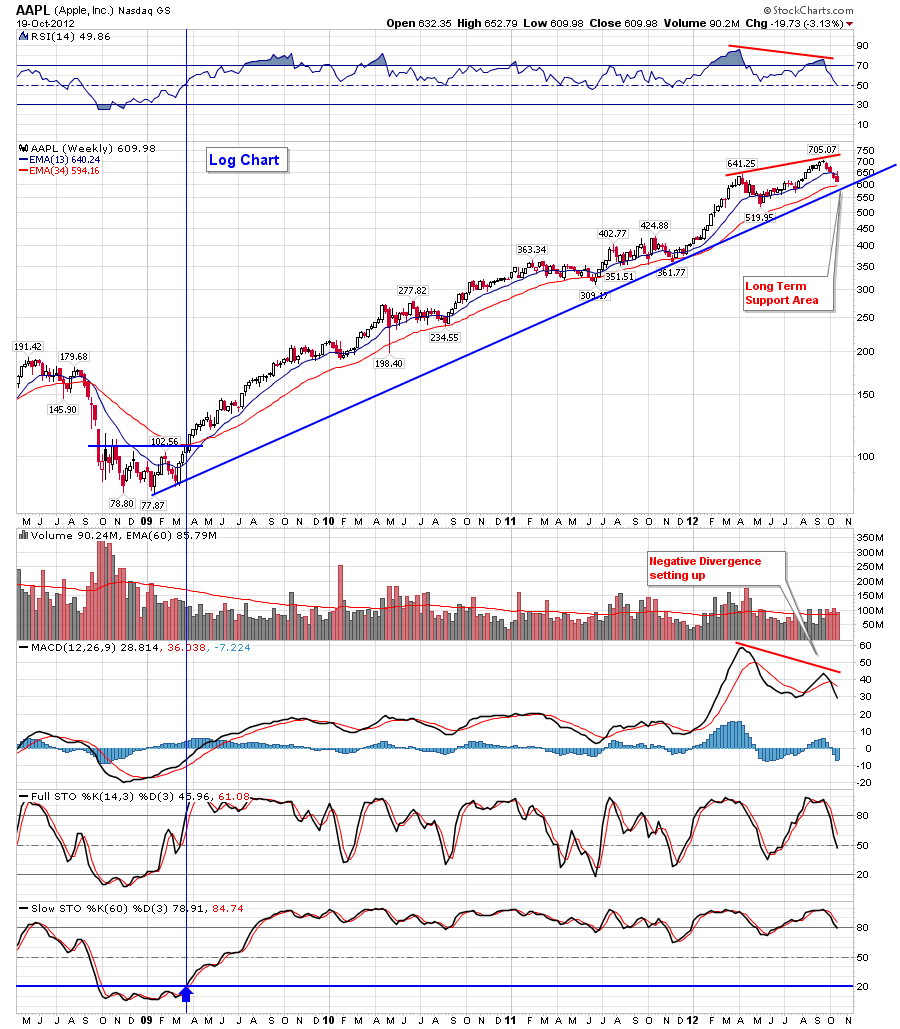
AAPL - Chart Link - weekly chart 1, this is a logarithmic chart, uptrend line approaching around the 600 or high 500's range.
AAPL - Chart Link - weekly linear chart, long long term support much lower below, but no reason to discuss this trendline at this time, though eventually I bet it will test it.
AAPL - Chart Link - daily chart shown weeks ago, had a little H&S top, obviously played out, then broke an uptrend line. The 200 day MA is below and might be a target over time. Or short term might get a bounce back to back test the broken uptrend line.
AAPL - Chart Link - daily wave count that I showed months ago, clearly that wave 5 played out.
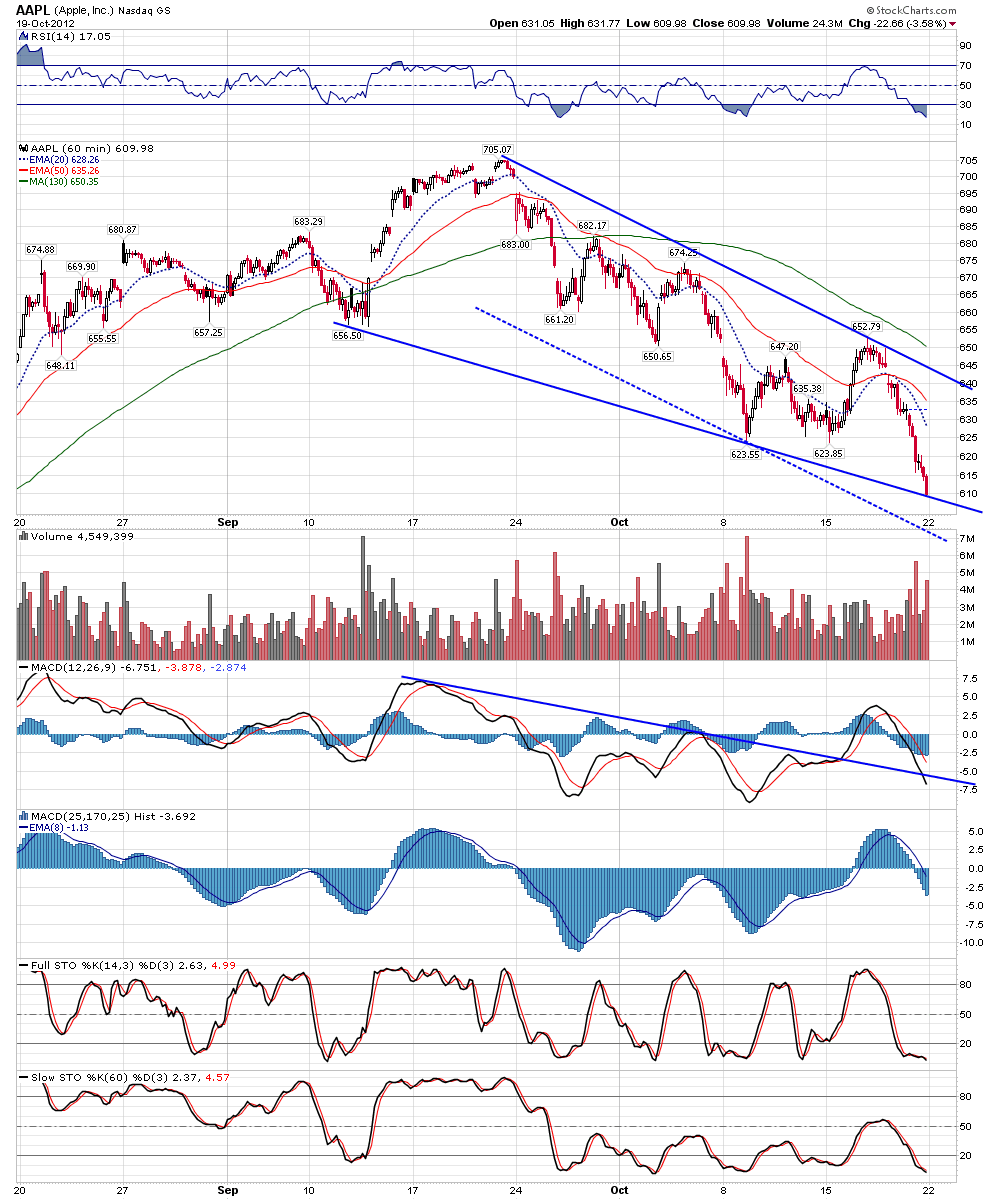
AAPL - Chart Link - 60 min view
AAPL - Chart Link - 15 min view, still no positive divergence.


No comments:
Post a Comment