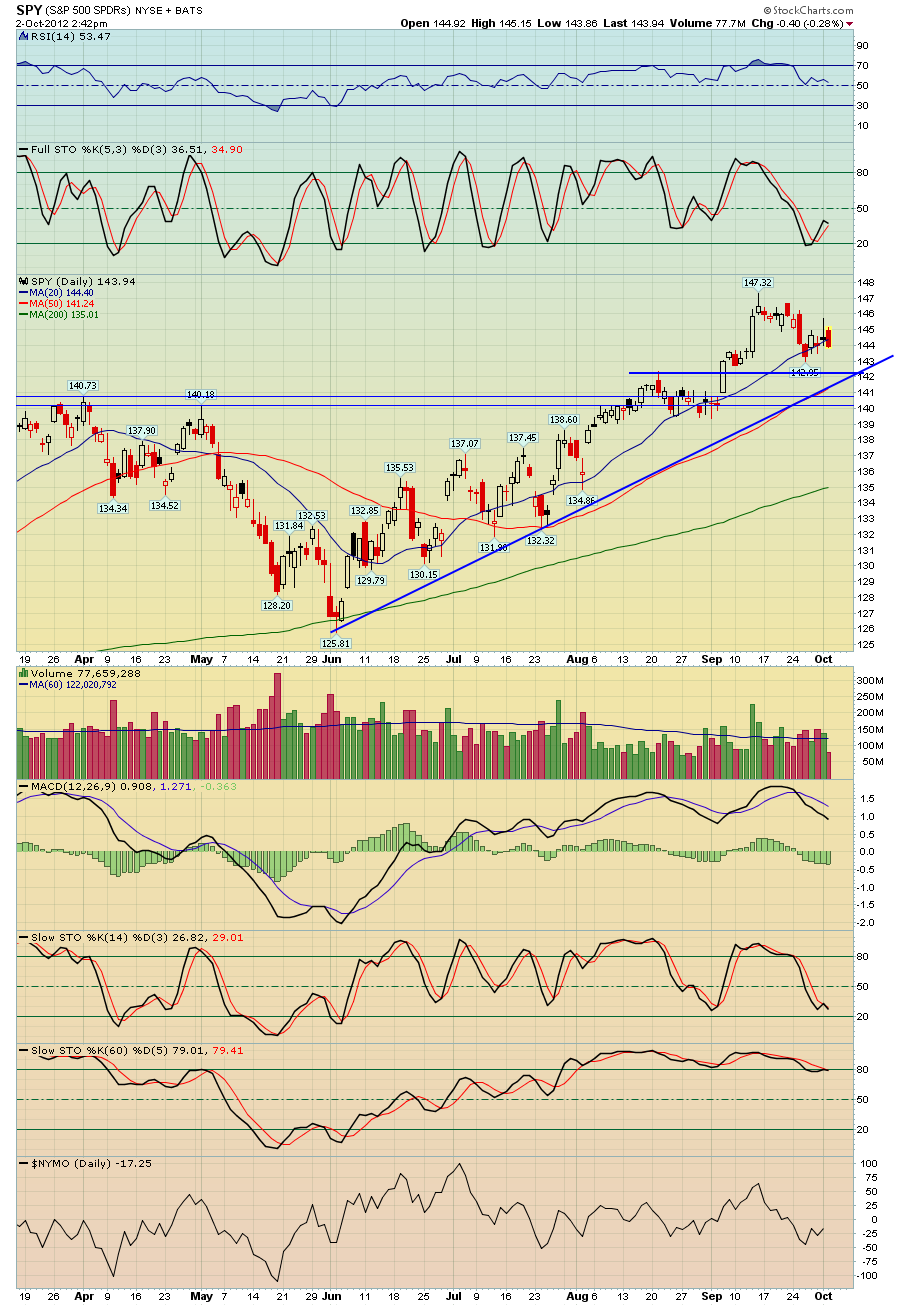
$SPX - Chart Link - here's a daily chart of the S&P 500, it's been in correction mode for the last 2 weeks, which should surprise no one, it was quite bought and closed above the upper Bollinger Band with an inverted hammer. As you can see on the chart, there are three 'key' technical support levels below that all match up right around the same place: 1. The uptrend line, 2. the 50 day MA, 3 the horizontal support line. I would buy a buyer near those areas.
SPY - Chart Link - Here's the daily ETF, SPY

No comments:
Post a Comment