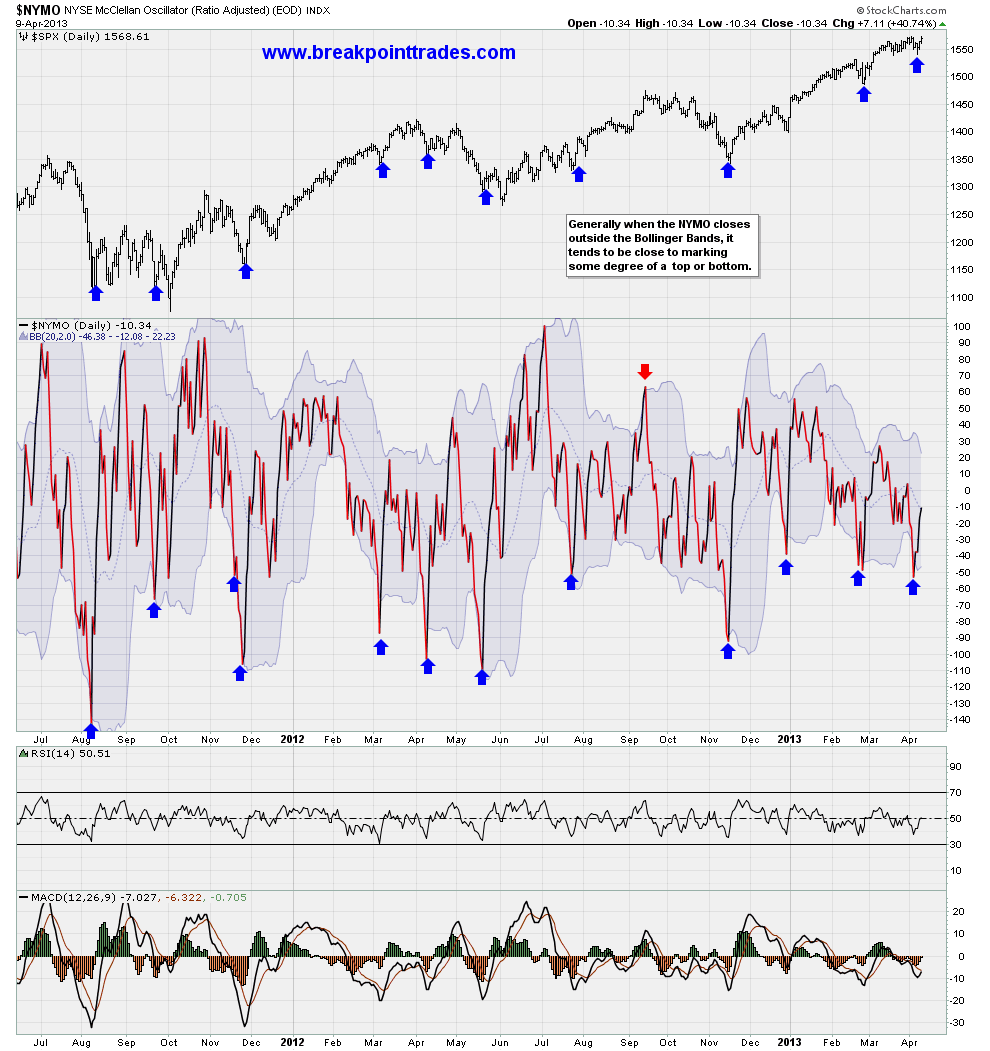
Well...I guess these suckers worked once again, last week on Thursday, these two indicators spiked below their lower Bollinger Bands, which as you can see in the past has produced tradeable bottoms, since the Dow Jones closed at a new high and the SPX got very close, I guess these nifty indicators worked again! I posted these two charts last week, see my post from last week Thursday.
Tuesday, April 9, 2013

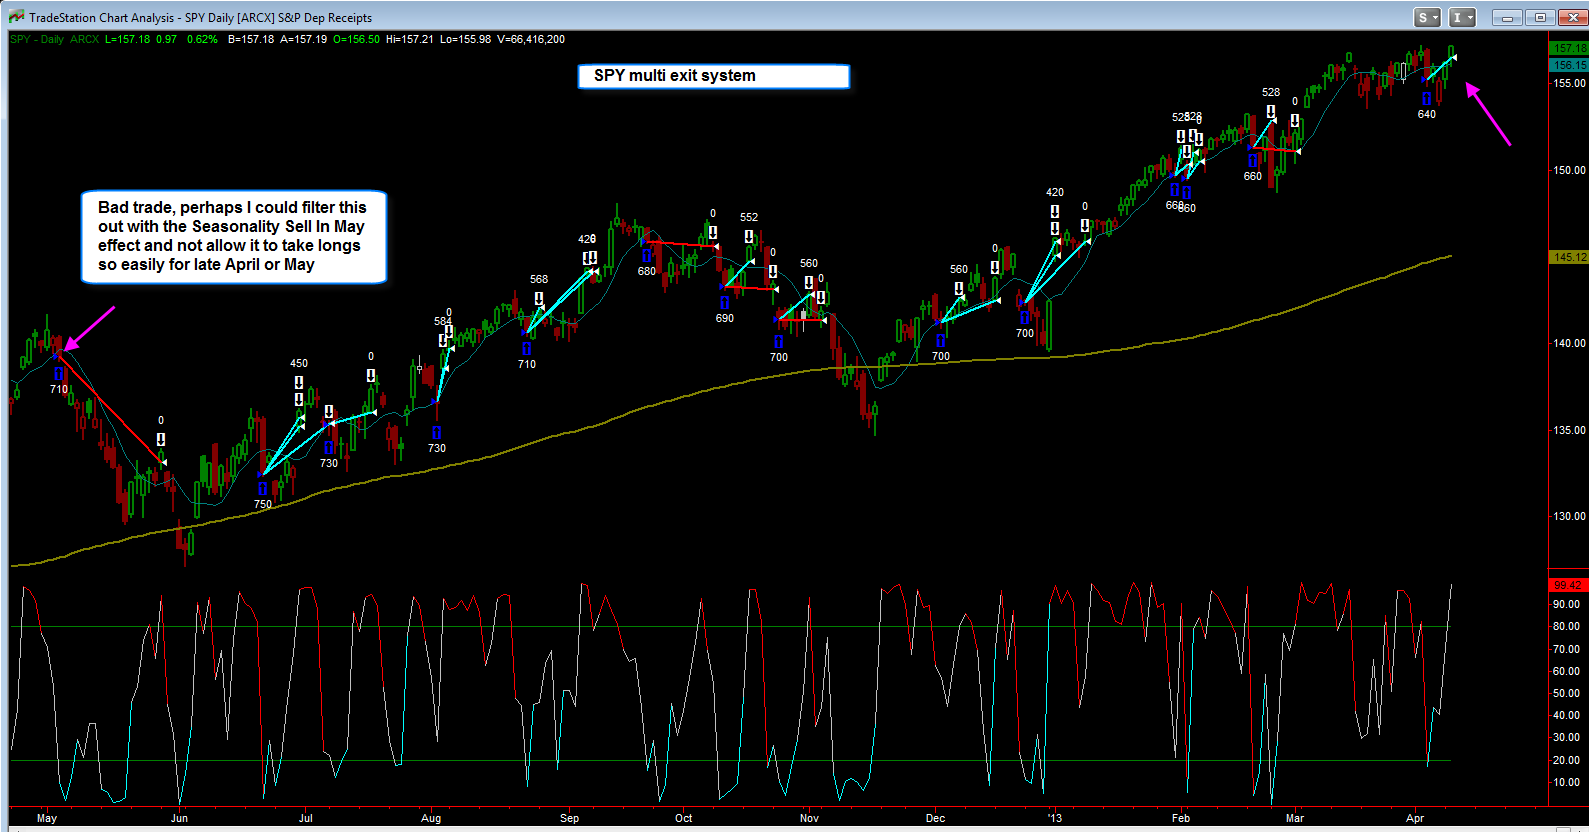
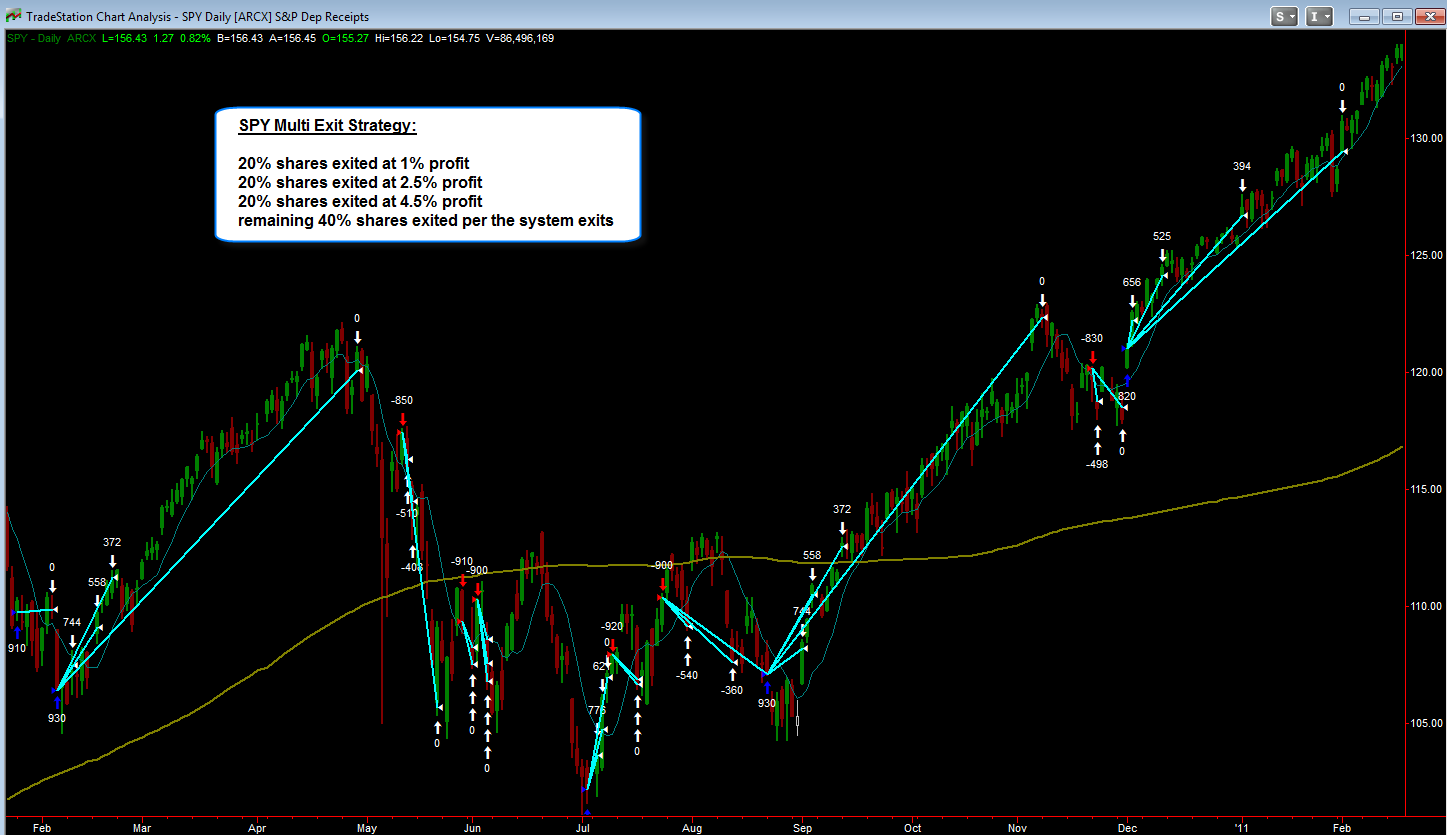
here's a follow up to that SPY multi exit system, ...
here's a follow up to that SPY multi exit system, as I stated last night it would be exiting today on the open, of course it missed today's move, but still a profitable trade. I attached the chart for confirmation. Also note the bad trade from last year May 3 when it went long, as I stated last night one thought I have is to limit the system from taking longs to easily in late April and May due to the Sell in May effect that is so common. I also bring this up because even though the system has almost 96% winning trades, it can and will have bad trades like that from time to time. I'm thinking about adding this system to the 'Tradestation Systems section of the website and perhaps taking away one of the other SPY systems as I already have so many there.
Also **Click Here** to view a detailed performance report, all the trades are listed and other statistics
ANV follow up
Here's a follow up to the gold stock that I posted about a week ago which has been so severely beaten down, AVN. As you can see, ANV is having a huge day, up almost 26%! Also technically notice that it bounced off the lower trendline channel support.
Let's see if it can have some follow through

Market Comments
$INDU - Chart Link - The Dow made new high and the SPX came within a gnats hair of it. Again the market is good at screwing the bears or the top pickers. That's why it's good to take at least partial profits if you do catch a top, as we stated, they are emotional affairs and always choppy
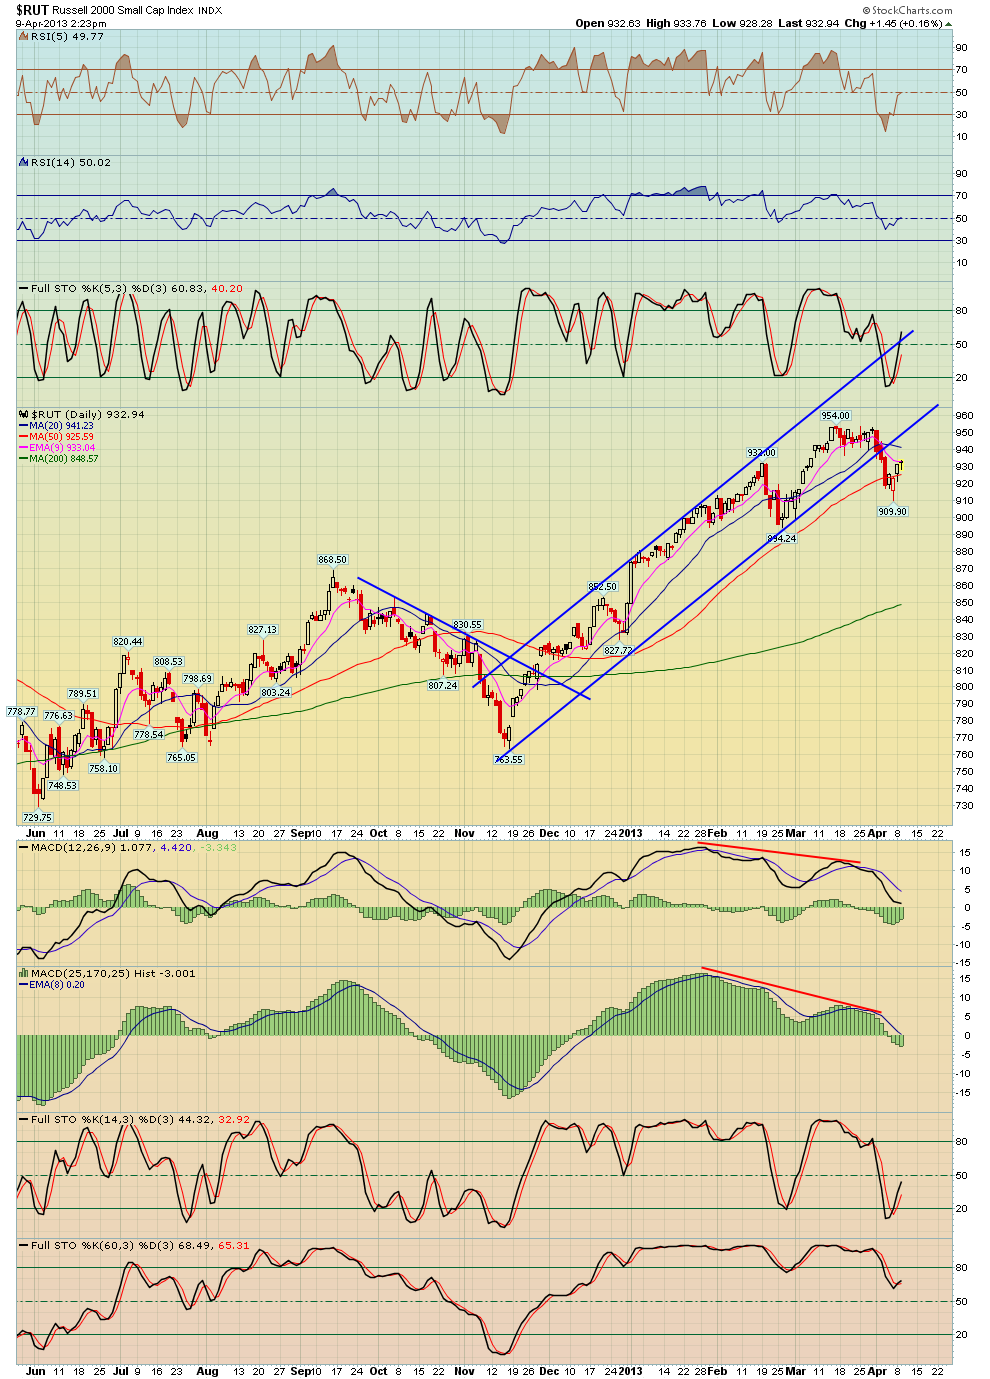
$RUT - Chart Link - otherwise the RUT small caps continue to lag and it's one area I'm focused on for a better short
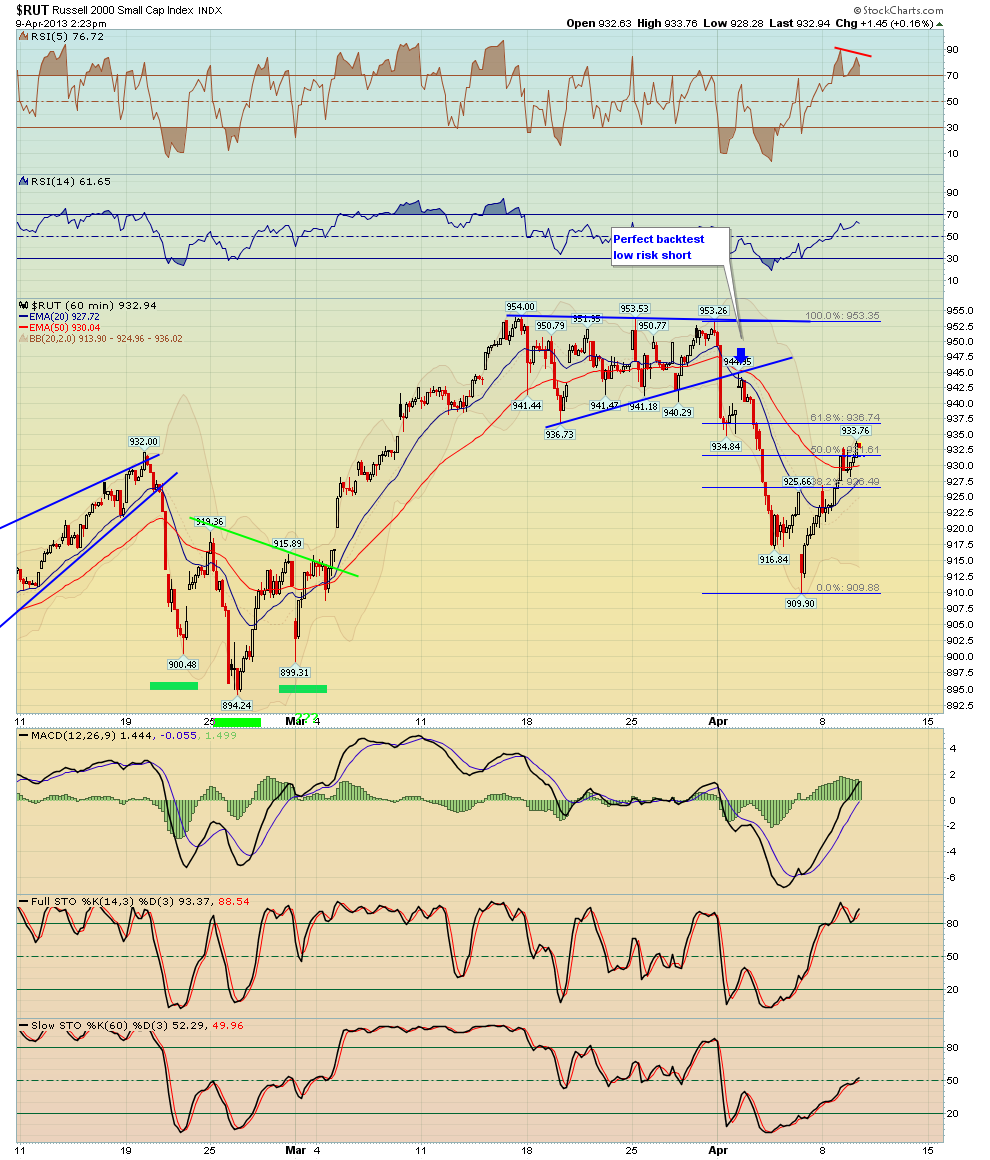
$RUT - Chart Link - here's a 60 min view, note that it hasn't even retraced 61.8% of the pullback, and there is some divergence on the 5 RSI. It's one to watch

SMH - Semiconductor ETF
SMH - Chart Link - has rallied back close to the neckline of the H&S pattern, could be a lower risk short near that neckline with a fairly tight stop

Monday, April 8, 2013
SPY system I may add to the site
Here's an offshoot of one of the reversion to mean SPY systems that I may be adding to the 'Tradestation Systems' section of the website. I added a scale out component to it: Sell 20% of shares after a 1% gain, sell 20% of shares at a 2.5% gain, and another 20% of shares at a 4.5% gain. Exit the remaining 40% shares per the normal system exit. The total profit is lower however the % winning trades goes up to almost 96%
Again it's not a perfect system, there will be bad trades, for example take a look at the last chart example, you can see how it bought the pullback on May 3rd, which ended up being quite a bad trade; I would like to add some kind of Sell In May seasonality component where the system needs a deeper pullback or more stringent rules to take a long in late April - June etc.
Also if you look at the yearly stats, the totals are % gains for the year, before 2012 reversion to mean systems did well, however I have noticed that most reversion to mean systems started to struggle from 2011 and into 2012. However so far this year it's doing better than last year


Comments on AAPL technicals/charts
A few of you wrote me to ask me for my analysis on AAPL since we have covered it so well the last year, here's my thoughts:
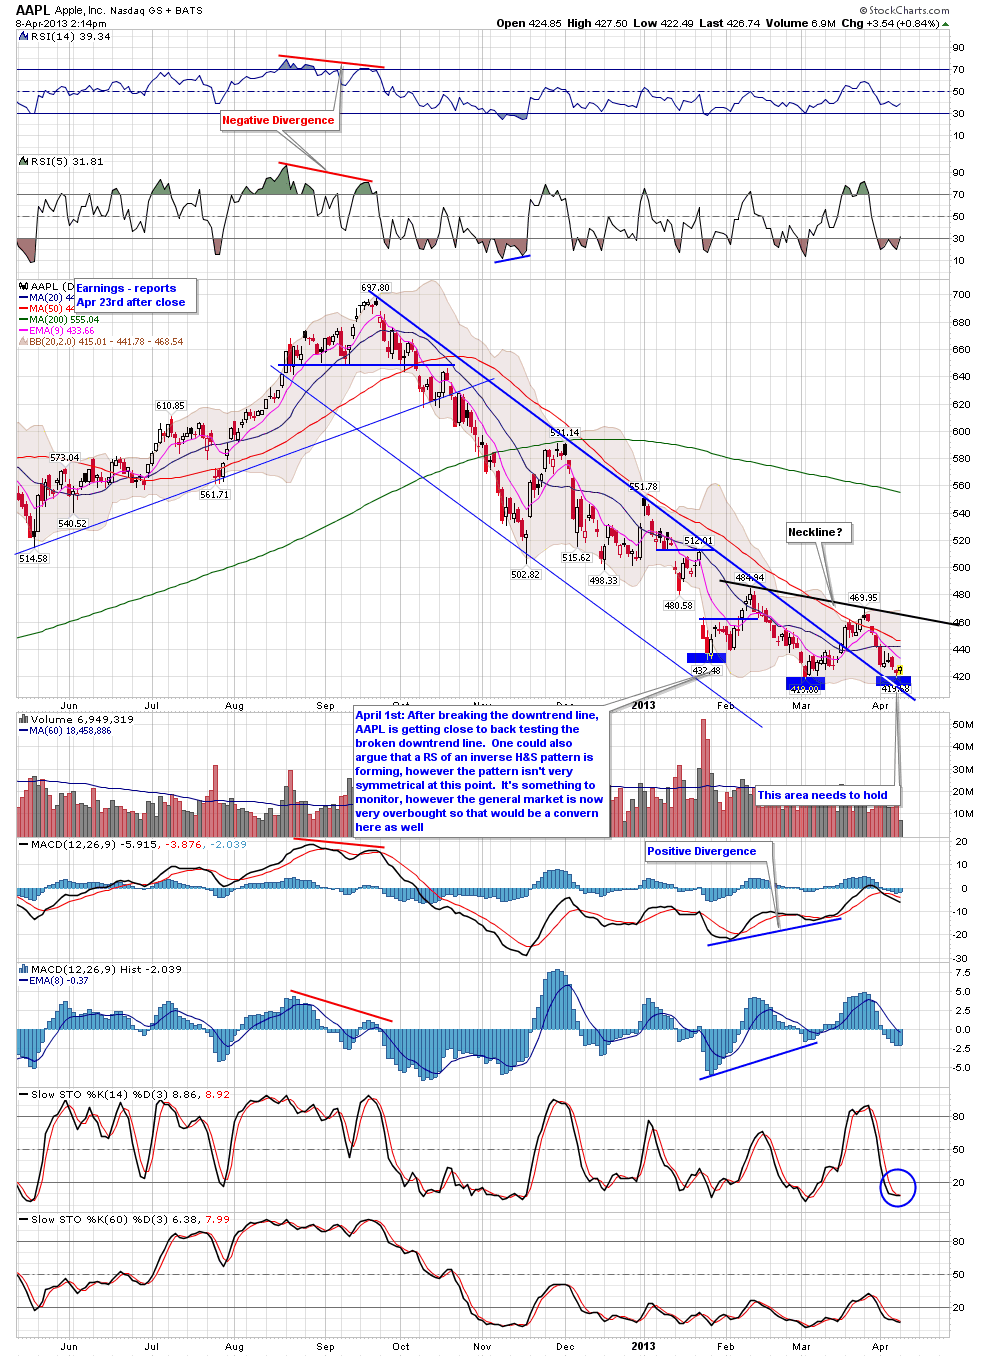
The first chart shows a daily chart, one of you asked if a slanted inverse Head and Shoulder pattern could be forming with the right shoulder currently in the process of forming. Yes it's a valid pattern for now, however you don't want to see price dip much lower otherwise it will lose symmetry. Otherwise the broken downtrend line is also a support area, a stop could go below there.
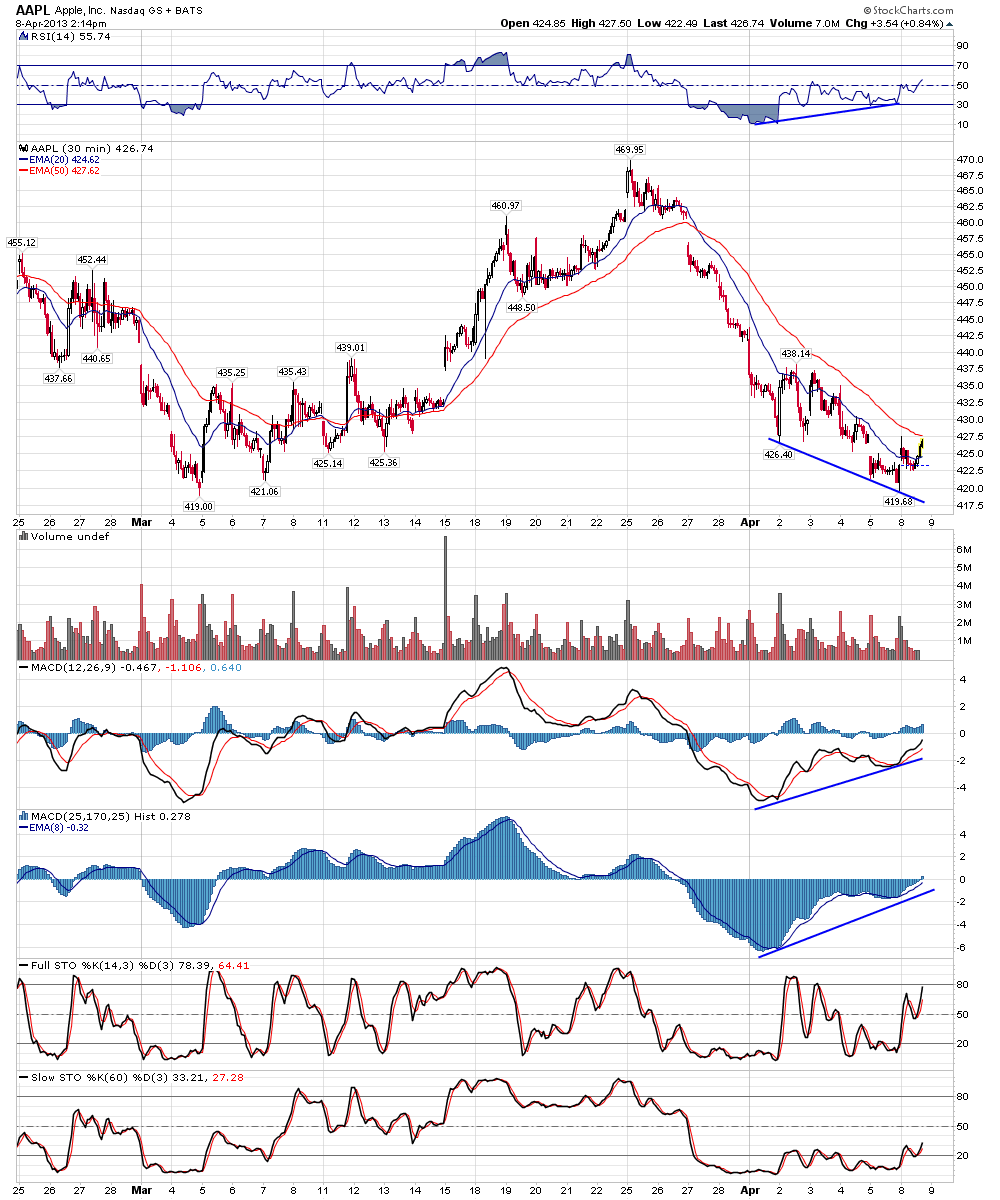
The next two charts show 30 and 60 min charts of AAPL, there is positive divergence via the MACD and RSI indicators, therefore a bounce potential exists.
My only concern would be the general market, if this pattern had formed a while back, while the market still had a lot of room to run I would like it better. If the general market decides to have a correction, could AAPL bounce that far? Probably not. Of course that's the question in the short term, has the general market starting some kind of correction, or is it simply consolidating for another push higher? Currently the S&P 500 has retraced 50% of the pullback from the April 2nd highs, so we'll see.
Let's see how AAPL plays out over the next week or so

Sunday, April 7, 2013
General Market Newsletter Sunday April 7th
Here's our weekend General Market Newsletter, the market is at an inflection point, therefore you should take the time to review this.
*Click Here* to view the newsletter
The weekend commodity newsletter was also sent out to paid subscribers of Breakpoint Trades
let's see what this week brings us!
XXIA Trading Education Example - one of our recent short ideas
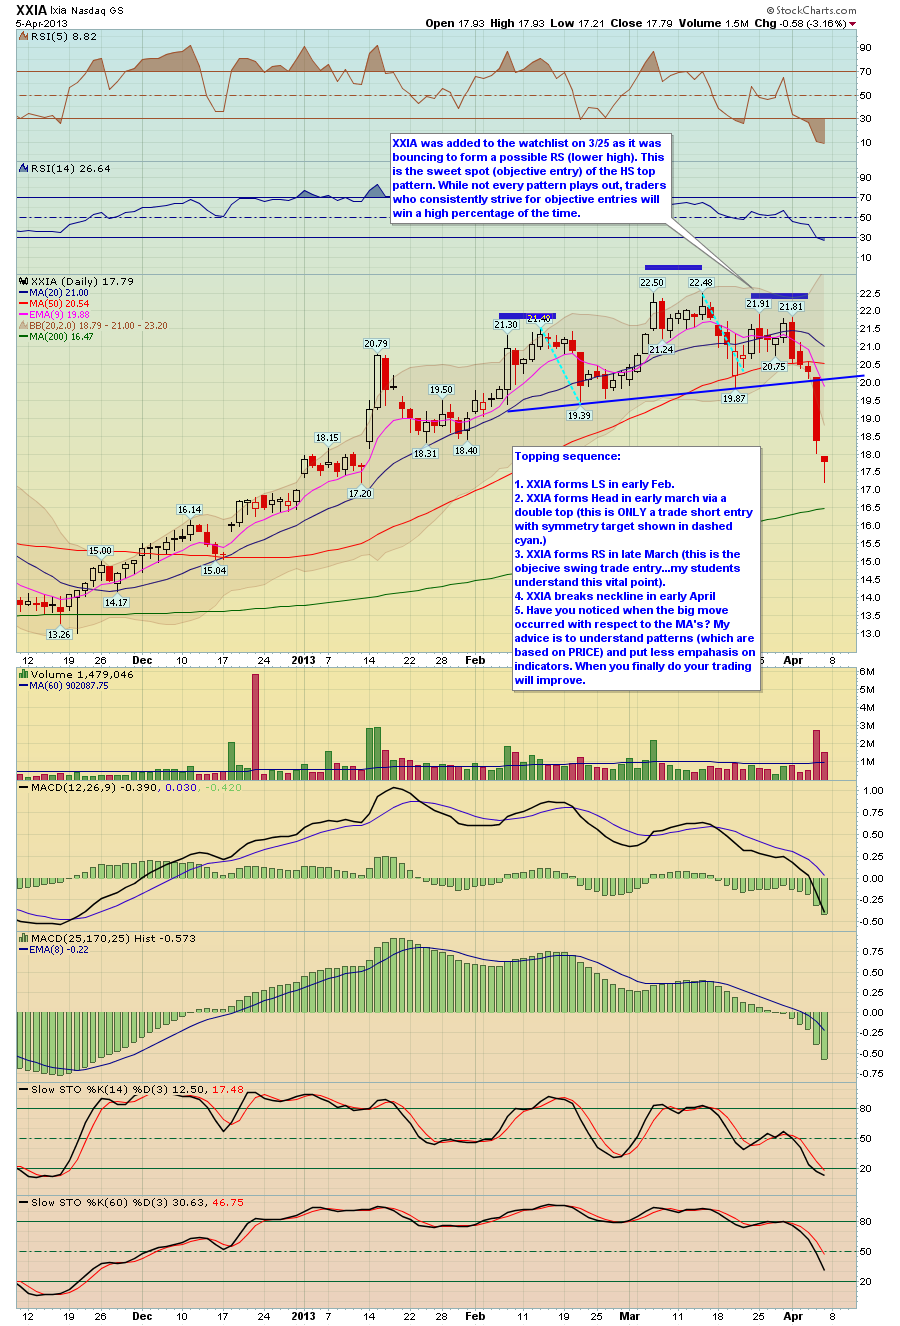
Topping sequence:
1. XXIA forms LS in early Feb.
2. XXIA forms Head in early march via a double top (this is ONLY a trade short entry with symmetry target shown in dashed cyan.)
3. XXIA forms RS in late March (this is the objecive swing trade entry...my students understand this vital point).
4. XXIA breaks neckline in early April
5. Have you noticed when the big move occurred with respect to the MA's? If this is not crystal clear to you then take a tutorial to understand. My advice is to understand patterns (which are based on PRICE) and put less emphasis on indicators. When you finally do your trading will improve.
Friday, April 5, 2013
Silver bounced off the long term support trendline
Silver bounced off the long term support trendline for now, I pointed this out yesterday, this trendline has held since 2011, will be interesting to see how this plays out going forward.

Market Close
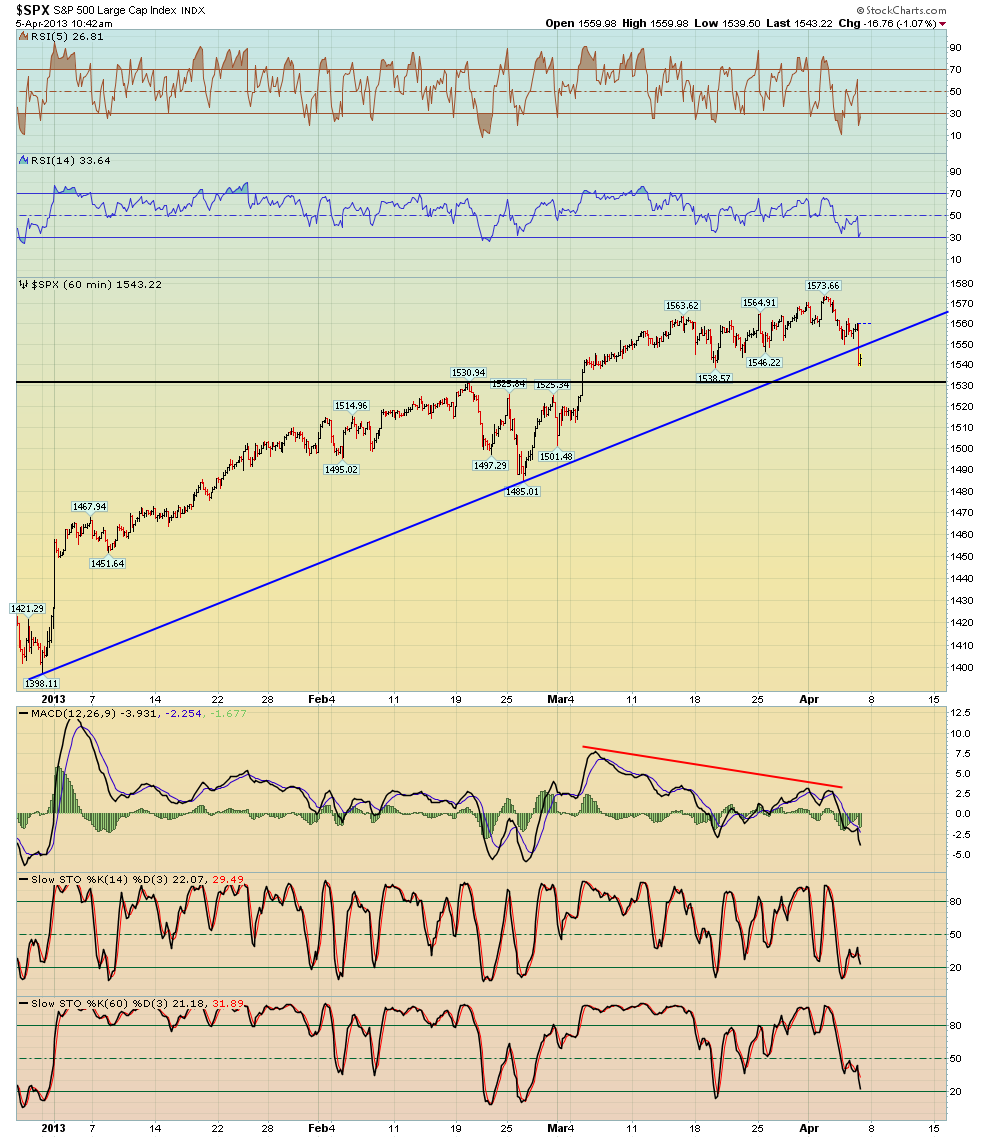
The SPX managed to rally back off the lows to only end up down less than 7 points. The SPX bounced exactly off or initial target of 1540, which was a good place to take profits on shorts. And if you wanted to take another short at higher prices near the close you are in a much better position than if you had held. Otherwise I drew a channel (see the black lines) for next week I still favor some kind of lower high to be in place and then another pullback - but as we know with this QE driving market, anything is possible.
take care and we'll have have two comprehensive newsletters for the weekend!
*Click Here* to sign up for our paid service, right now we have a sale on our 6 month membership, which is 50% cheaper than our standard monthly membership!
BPT just turned 10 years old!

ANV gold stock
ANV - Chart Link - Man some of the corrections in the precious metal gold stocks from last October are amazing, such as ANV for example from from the low $40's to the $12's today. The best the 'bulls' can hope for is some kind of positive divergent low to form as long as it doesn't sell off too much more from here thus causing the divergence potential to be lost. If ANV can turn up and set up divergence then I might take a shot, otherwise just watching for now

Market Comments
The first chart here shows a 60 min S&P 500 chart, as you can see it hit our initial target support near the 1540 area after the ending diagonal pattern played out. Now we just have to see what it does, if you shorted the market a few days ago from our newsletters you could either have take some profits or give it more room, congrats if you took some shorts before today!
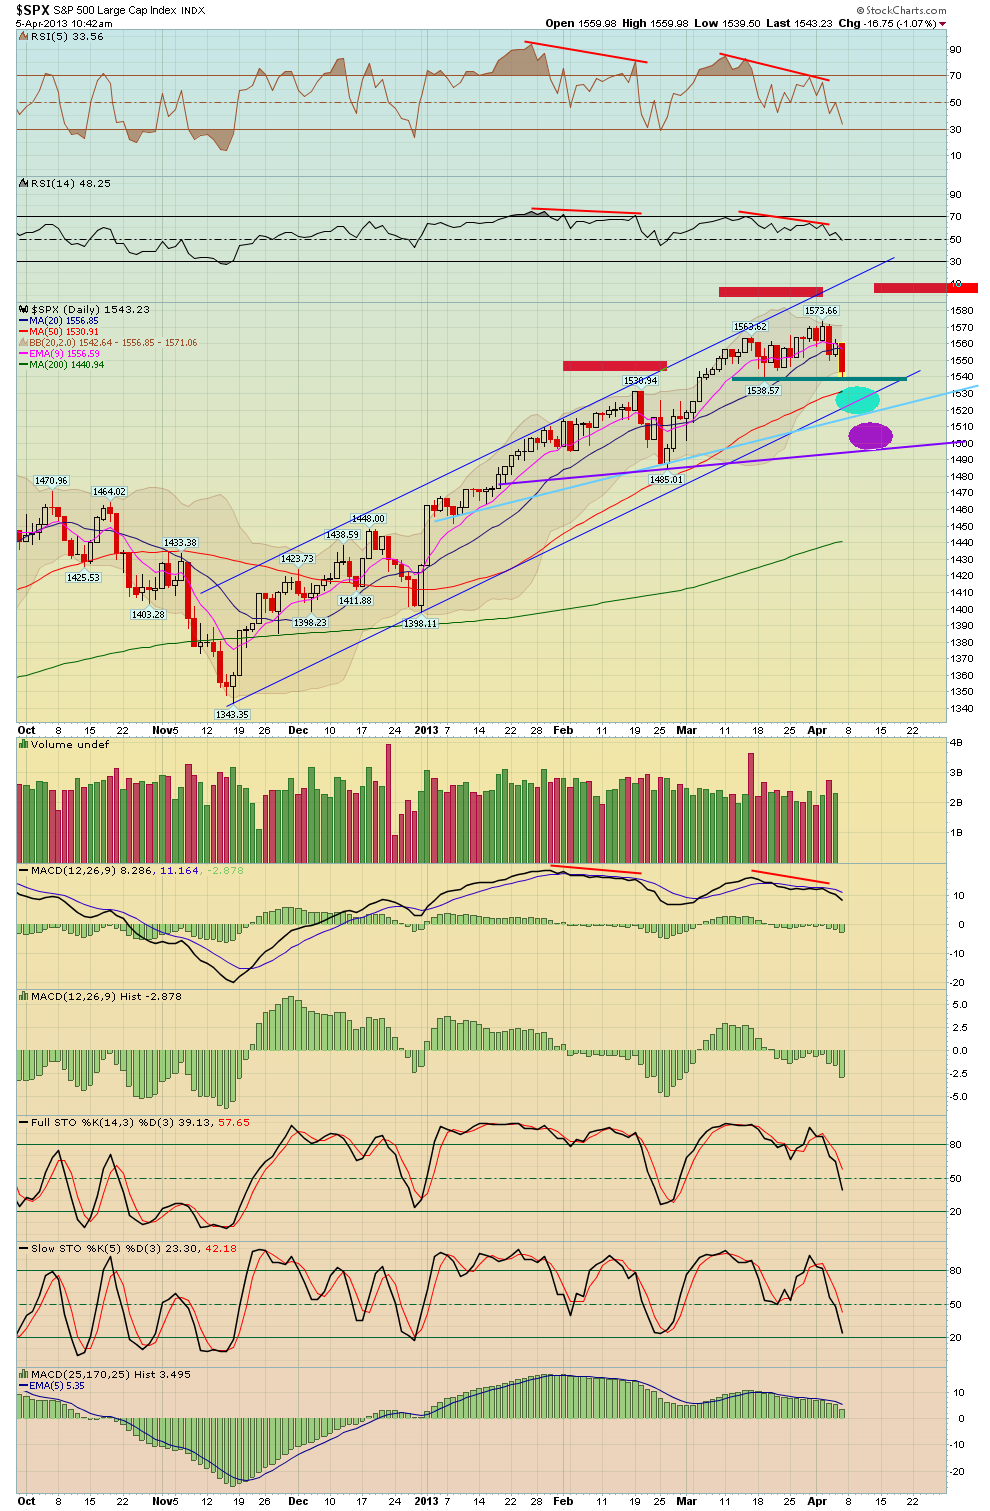
I've attached additional charts that we are following. Over time the 50 day MA to the downside or a slight breach of it might be a target. Otherwise on a bounce, watch your Fibs as well as the broken trendlines to mark resistance points.


Nice pullback in the market, I hope you guys caught some of these shorts!
Nice pullback in the market the last couple days, I hope you guys caught some of our short ideas from our newsletters!!
Semiconductor ETF's doing great, Russell 2000 short idea doing well,
ERY (-3X inverse ETF) doing great!
The jobs number was negative this morning, the rate fell to 7.6%, however nonfarm payrolls were only +88K, which is the smallest gain in 10 months.
However that ignore the news, the market charts were all aligned for a pullback


Thursday, April 4, 2013
Amazing, Silver is actually testing the long term support area ...
Amazing, Silver is actually testing the long term support area again! It'st tested this area so many times now, one worries that it's like a boy jumping up and down on a frozen lake, if he does it too many times, eventually the ice breaks. There is some minor support at $25 (see the thin line below) but below that nothing until 20 or high $19's
However on the flip side since Silver is at major support, one could take a long here with a fairly tight stop!

Subscribe to:
Posts (Atom)