Hello all dedicated readers of my blog, apologize for my lack of posts for the last few days, however I recently broke my left wrist quite severely, and just had major surgery. As you can imagine I have taken a break from the computer and it is also extremely difficult to type. However please stay tuned and keep my blog bookmarked
Thursday, June 13, 2013
Monday, June 10, 2013
SPY Systems follow up
as a follow up confirmation The SPY Pro and SPY Ver2 systems both exited there long positions today at the market open and the trade station systems section has now been updated to reflect this


Sunday, June 9, 2013

Friday, June 7, 2013
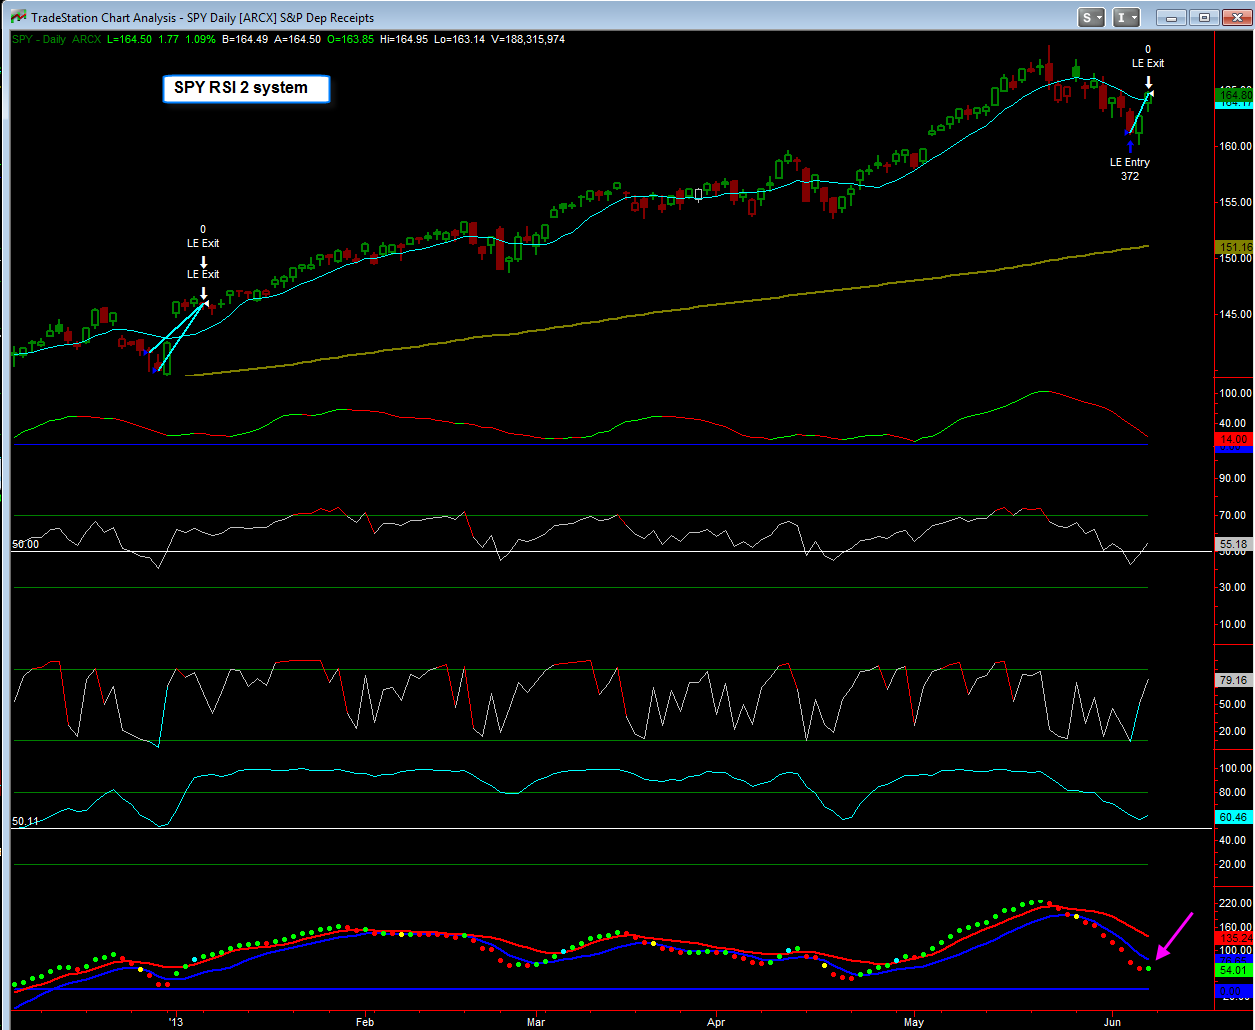
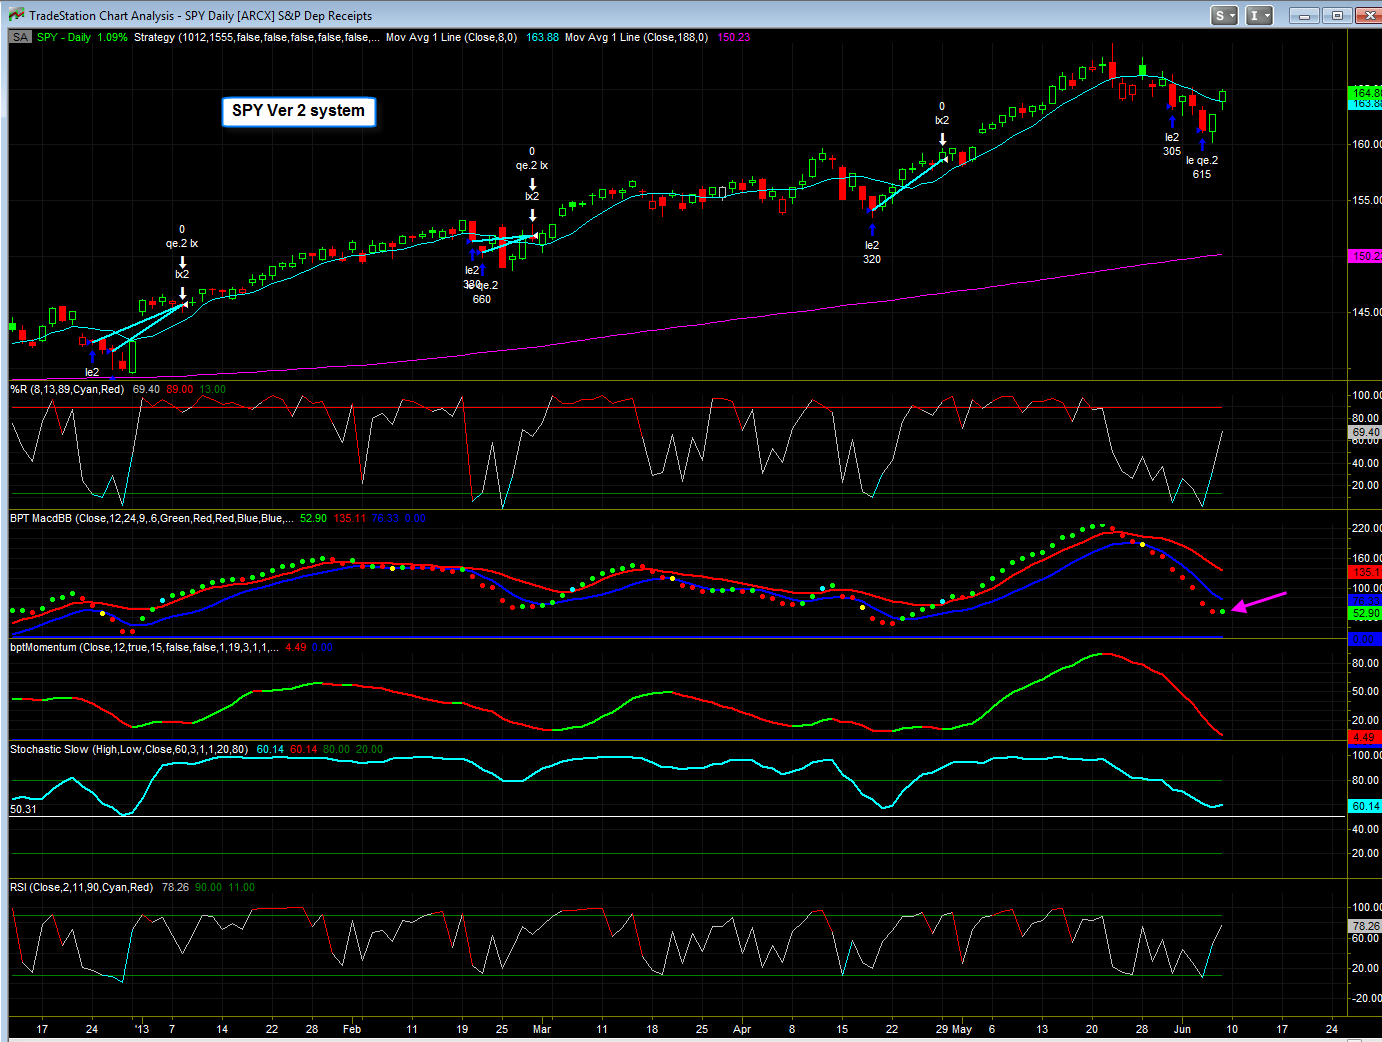
Great day for the mechanical systems
Great day for the mechanical systems, the SPY RSI 2, SPY VER 2, and SPY Pro systems, even the XLE system.
Remember, the SPY RSI 2 system excited today at the close, I have updated the website statistics to reflect this. The SPY VER 2, and SPY Pro systems systems will exit on Monday morning.
**CLICK HERE** to watch the video
Matthew Frailey

Market Update
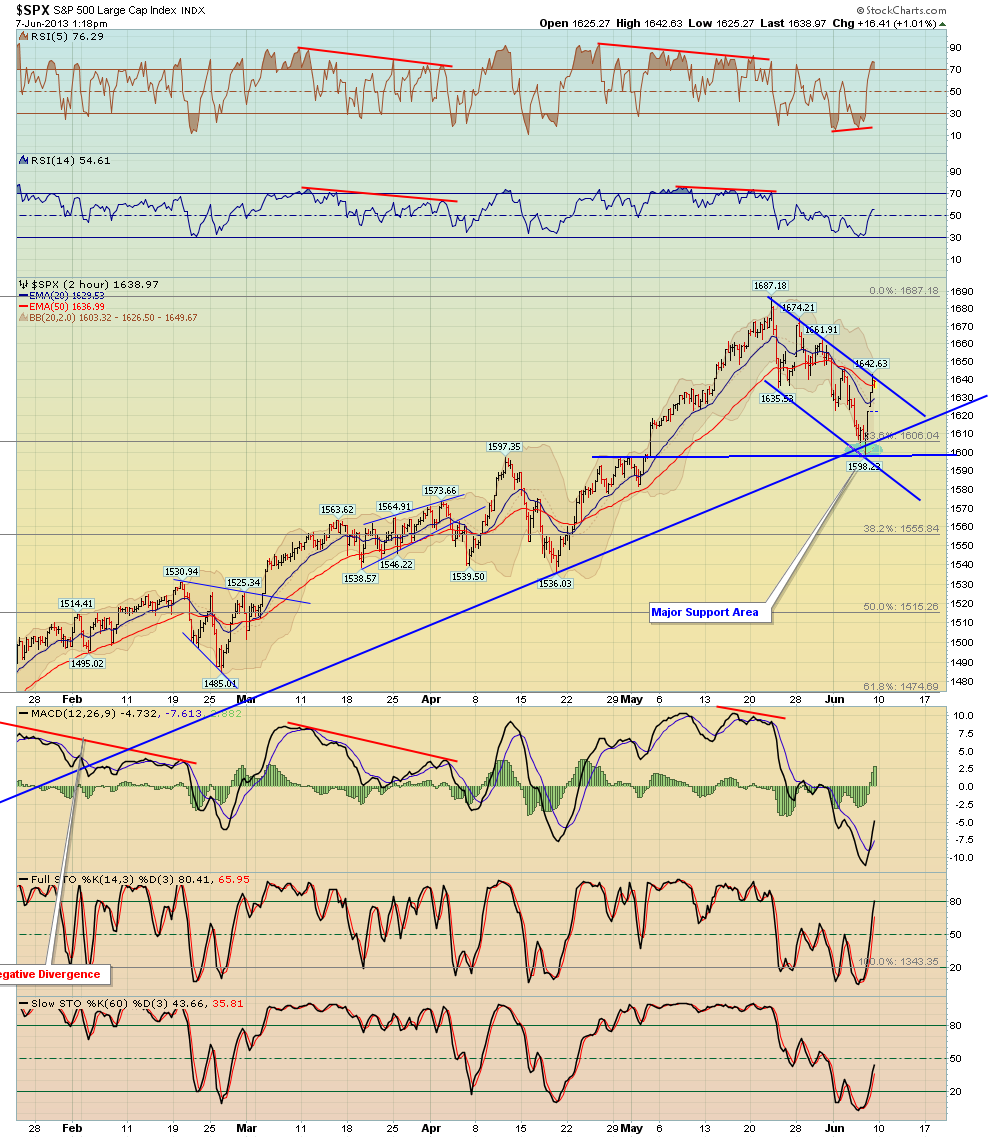
$SPX - Chart Link - as you can see perfect rally off the uptrend line that we showed before
$SPX - Chart Link - 2 hour chart showing the same uptrend line
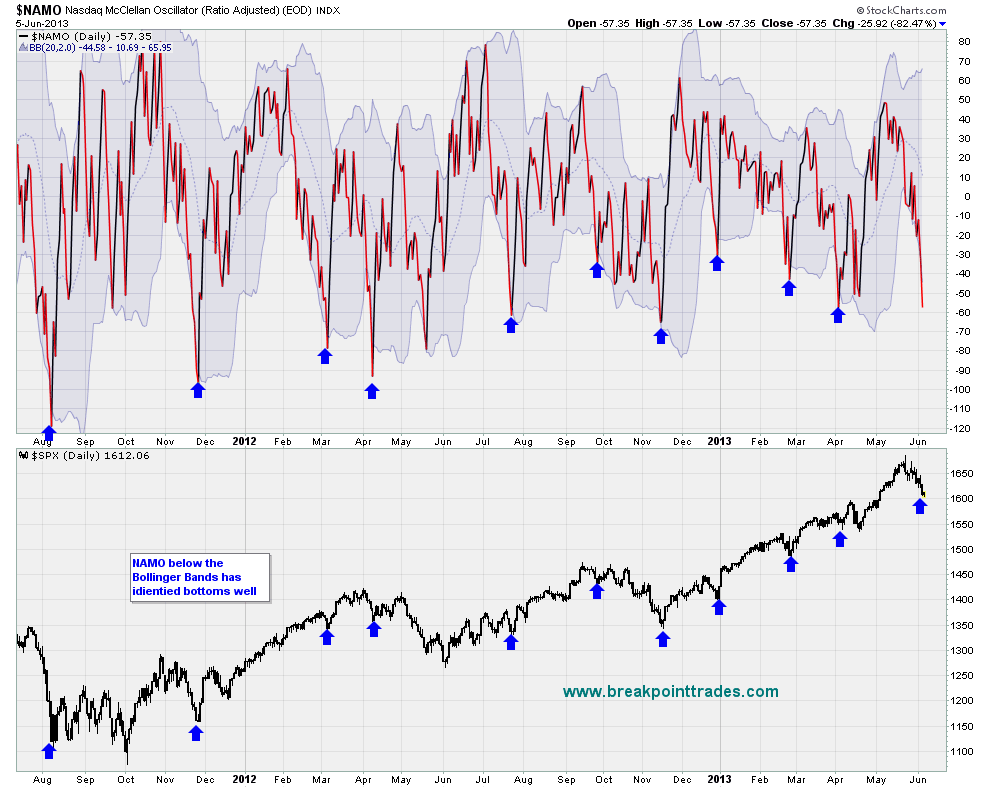
$NAMO - Chart Link - our custom NAMO indicator worked again beautifully, which as you can see gave a buy signal on Wednesday


Thursday, June 6, 2013
Here's two powerful indicators to monitor
Good morning! Here's a couple of powerful indicators to monitor in the coming days with the market at least oversold in the short term.
The first one shows the NYSE Advance Issues, notice that it has spiked to lows that were associated with previous lows in the market. However note that the the spike low during last May was not the bottom - it did produce a slight market bounce but then the market sold off again and made one more new low to finally mark a bottom two weeks later in June. The spike low for the indicator in mid Nov was the bottom however - therefore which scenario do we get this time? Personally I lean toward one like last May where the indicator marked a bounce point but then another low was made, why? Because the market just came off of a very strong 6 month rally - therefore I think more time is ultimately needed before the final low is in place - remember the market has only been in a correction for 2 weeks - is that long enough to work off the overbought nature from 6 months of strong rallying? probably not.
The second indicator shows our famous NAMO with Bollinger Bands - notice that the NAMO closed below it's lower BB's yesterday, it has been good at marking some tradeable bottoms.

Wednesday, June 5, 2013
In-depth market newsletter
Hello everyone, as you know the market had a large move today to the downside and has had a nice correctly the last couple weeks - here's our in-depth technical analysis on the market in newsletter form
**CLICK HERE**To View the Newsletter
Best to your week, Matthew Frailey
Market Observations
Hello everyone, as you know the market had a very strong pullback today, can't say we were surprised. The S&P 500 lost 22 1/2 points while the Dow Jones lost 217 points.
Here's a few charts that we are following:
The first chart shows a daily S&P 500 chart, as you can see the uptrend line from the November lows is fast approaching, should it fail to hold, the next major support areas are shown in green.
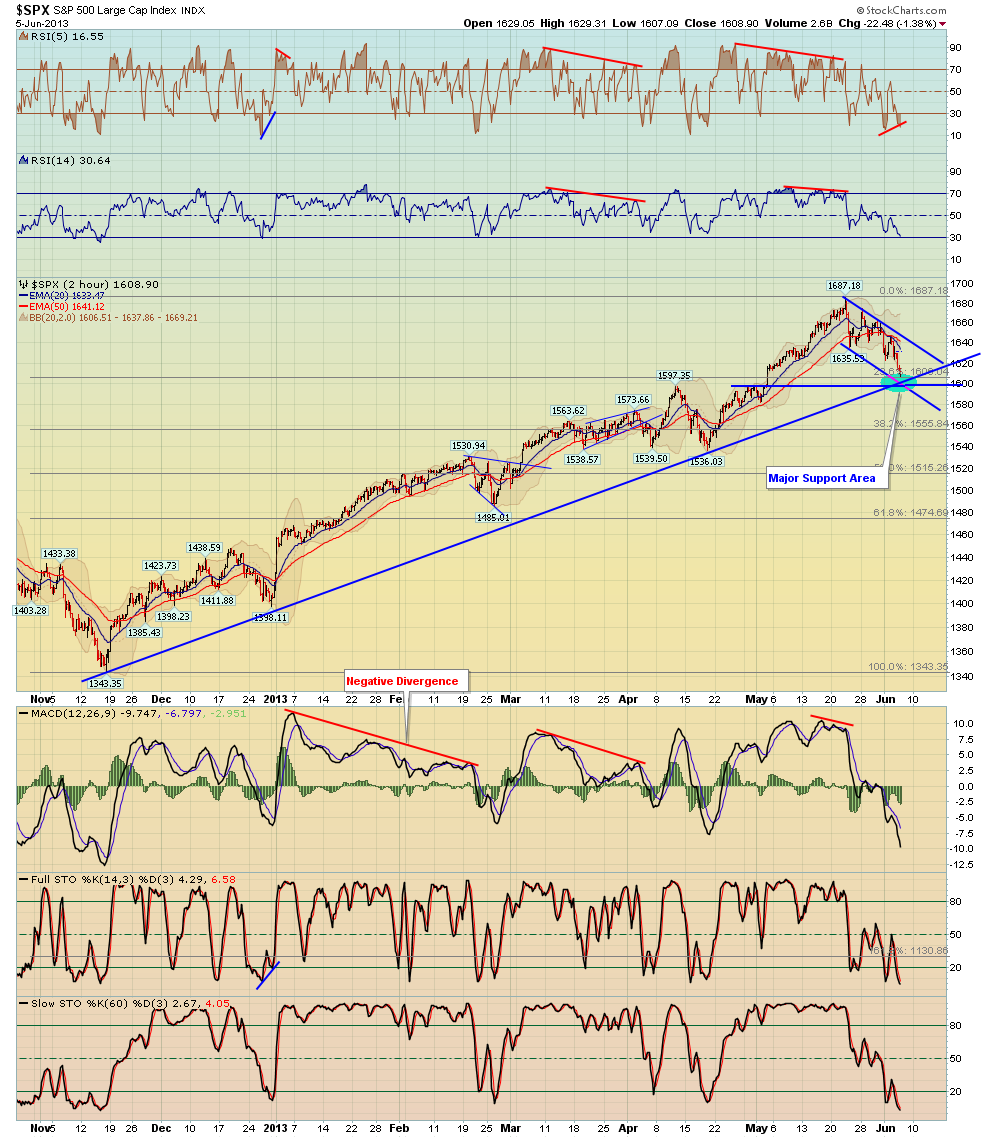
The second chart shows a 2 hr chart of the S&P for a closer view
The third chart shows a 30 min Diamond pattern, which is now into it's projected target zone.
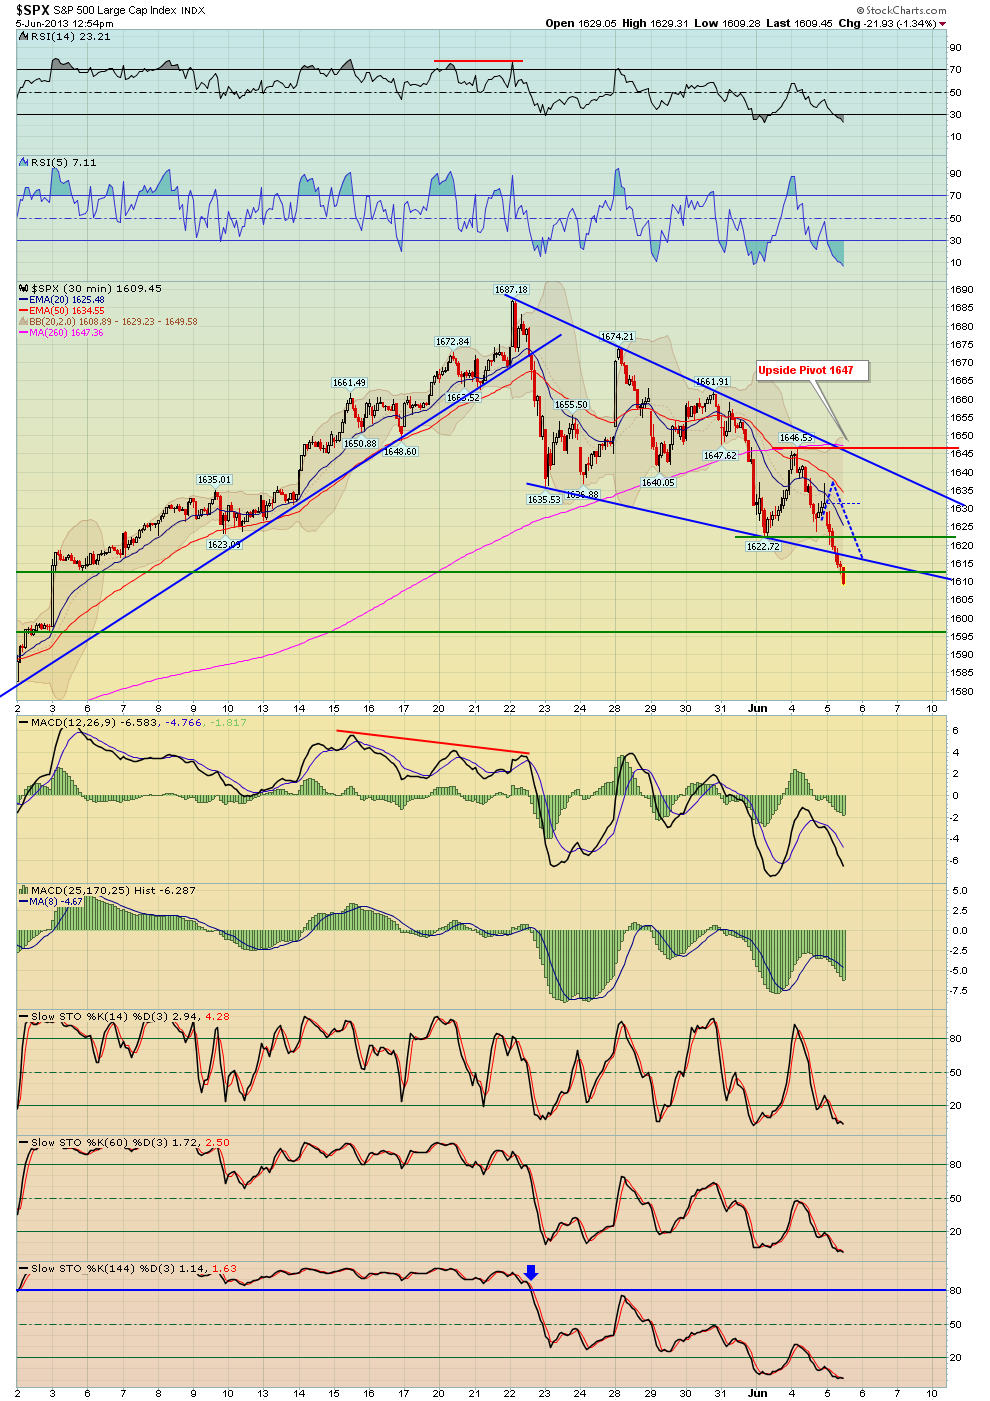
The last chart shows another 30 min chart of the S&P with our favored Elliot Wave count structure on the chart - if this is the correct count, then a bounce from here would only represent a 4th wave bounce which still needs another decline in wave 5 to complete.


Some SPX Intraday Views
SPX moving according to plan all week.......... I will remain cautious until evidence changes. Not looking to pick exact bottoms for swings. With that said, the indexes are quite oversold and thus one must be prepared for a bounce attempt.
I will remain cautious until evidence changes. Not looking to pick exact bottoms for swings. With that said, the indexes are quite oversold and thus one must be prepared for a bounce attempt.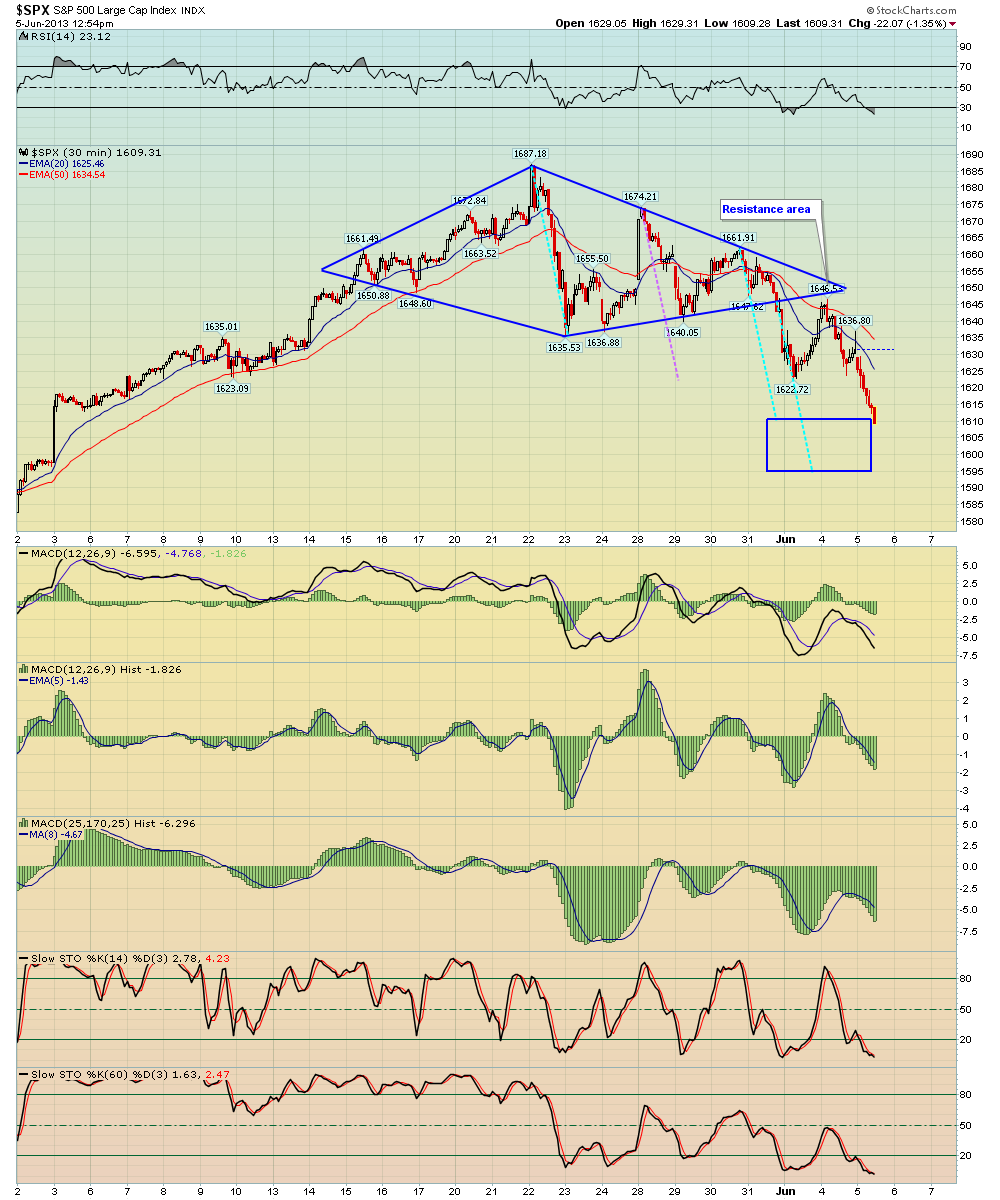


Tuesday, June 4, 2013
Quick intra day market comments
I posted this chart earlier, the S&P 500 was up today and is now down 14 points.
The bounce this morning was a perfect 'textbook' back test of the broken trendline - this also provided an outstanding low risk short trade against the S&P 500 today!

ANV gold stock follow up
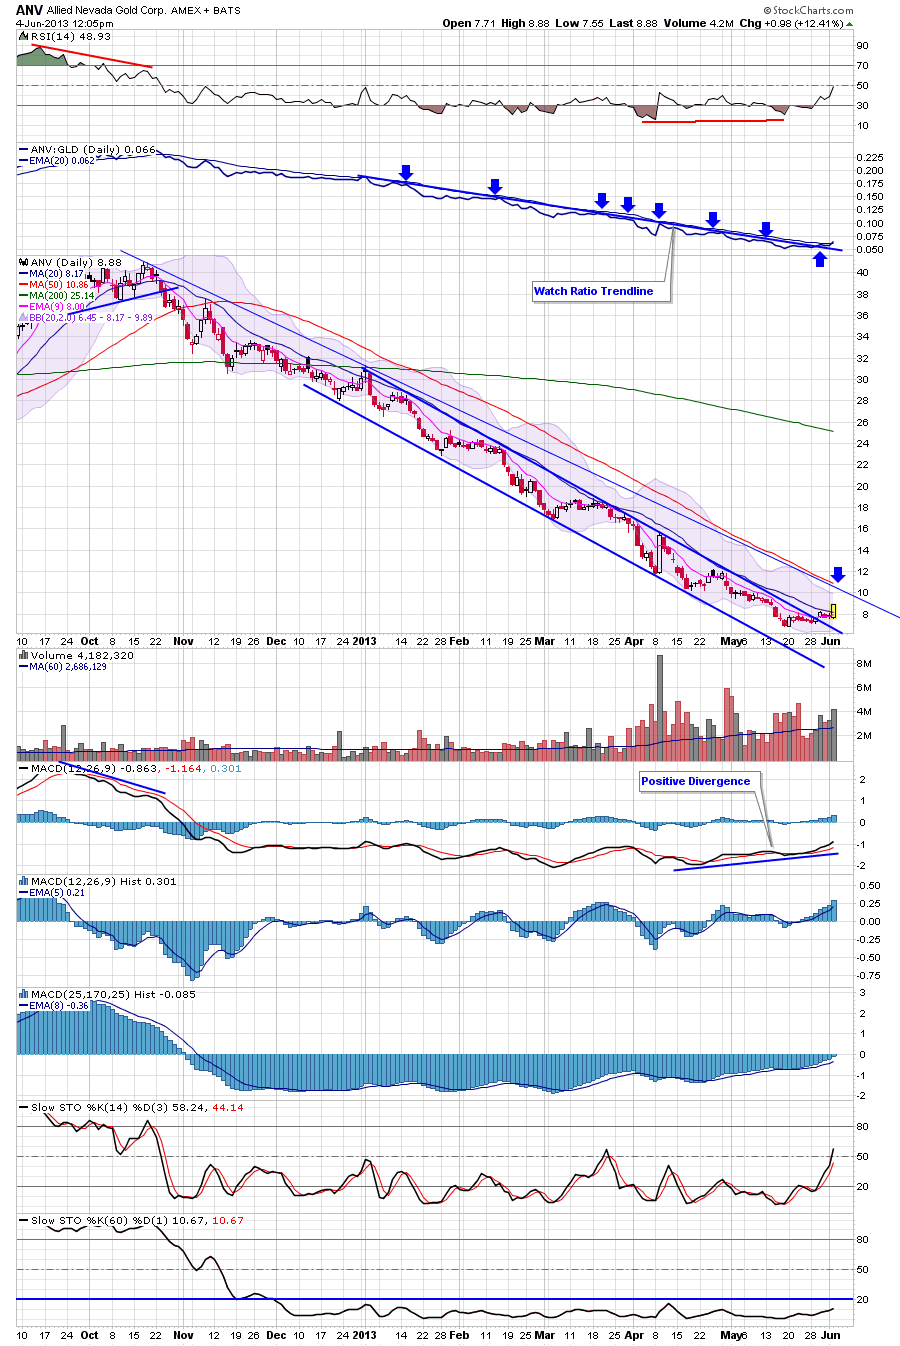
I posted ANV as a trade idea a while back, last week it finally broke the downtrend line on the price and on the ANV/GLD ratio, which was a bullish event. I especially find the ratio trendline breaks powerful for gold stocks.
The first potential target for ANV would be the 50 day MA in red, however because there was no base, I would then expect another pullback again - if the pullback is on lighter volume and forms a higher low, then one could try a swing trade with an initial stop at the higher low
Short term market comments
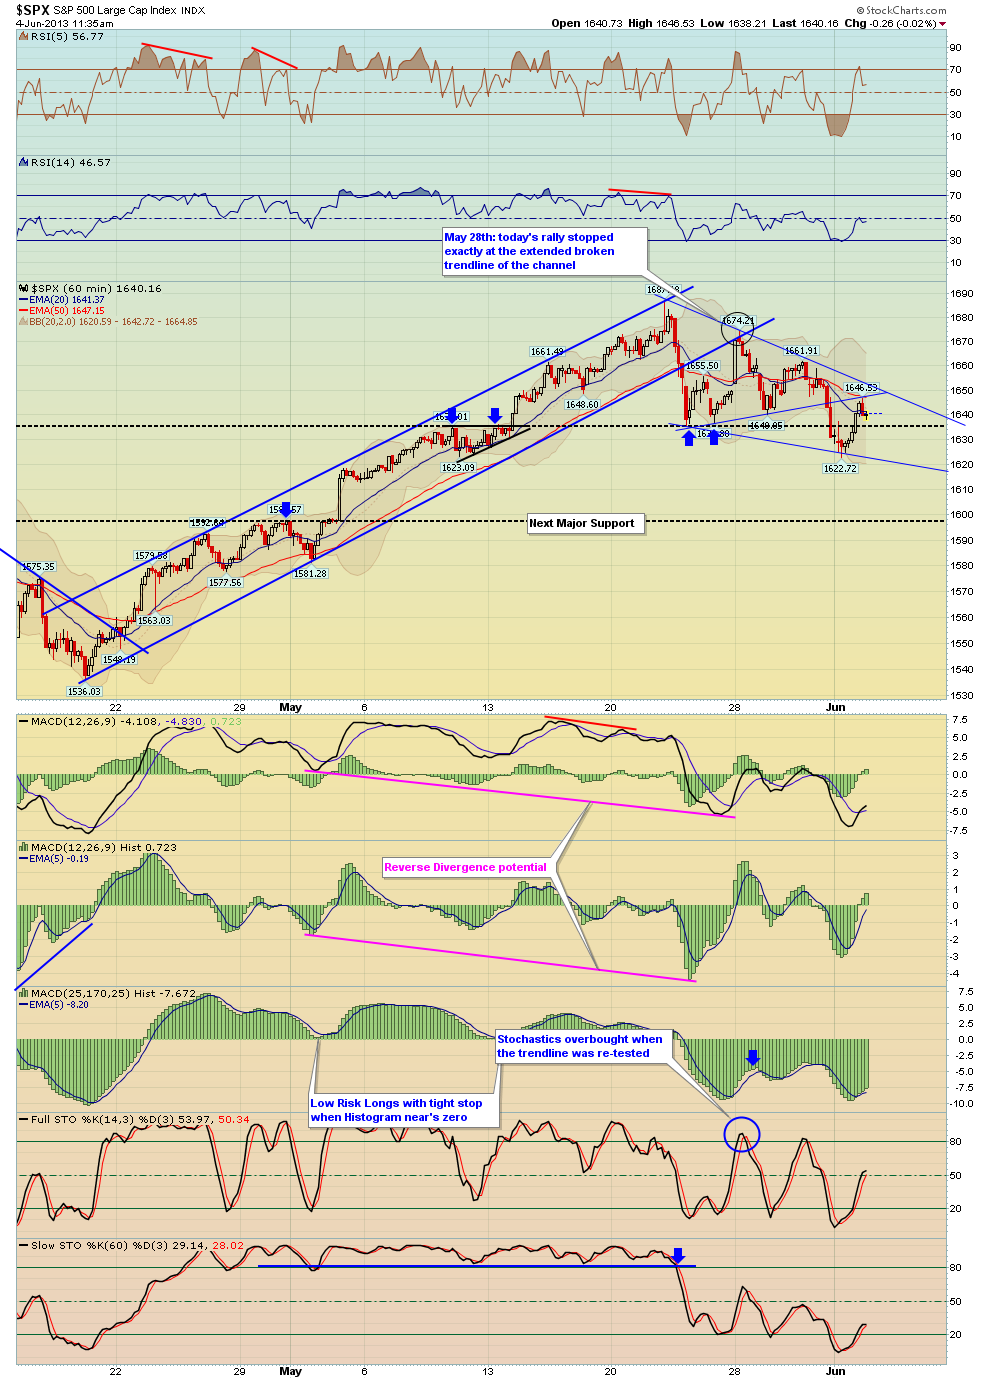
Here's a few charts from my newsletter last night - first off the SPX bounce from yesterday followed through this morning but notice that it stopped exactly at the broken trendline as shown on the 1st chart which is a 15 min chart.
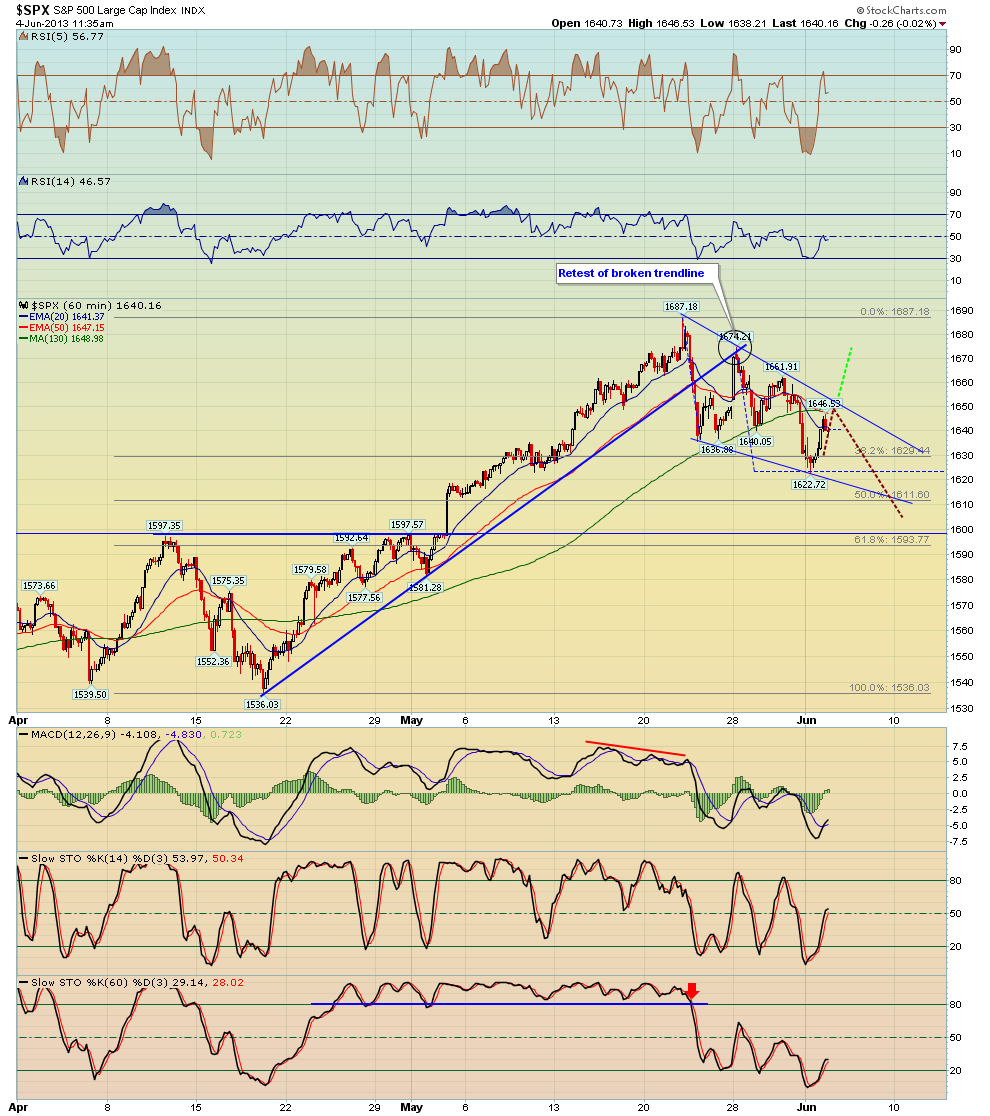
The next two charts are 60 min charts showing a potential wedge pattern. Resistance is clearly the downtrend line of the pattern. The first 60 min chart also shows the same broken trendline as the 15 min chart which was re-tested today. The second 60 min chart shows wedge scenario with 2 possibilities i.e. once scenario would break out of the pattern while the other one would have another sell off inside the pattern to the low 1600's and high 1500's. The downtrend line is major resistance

Monday, June 3, 2013
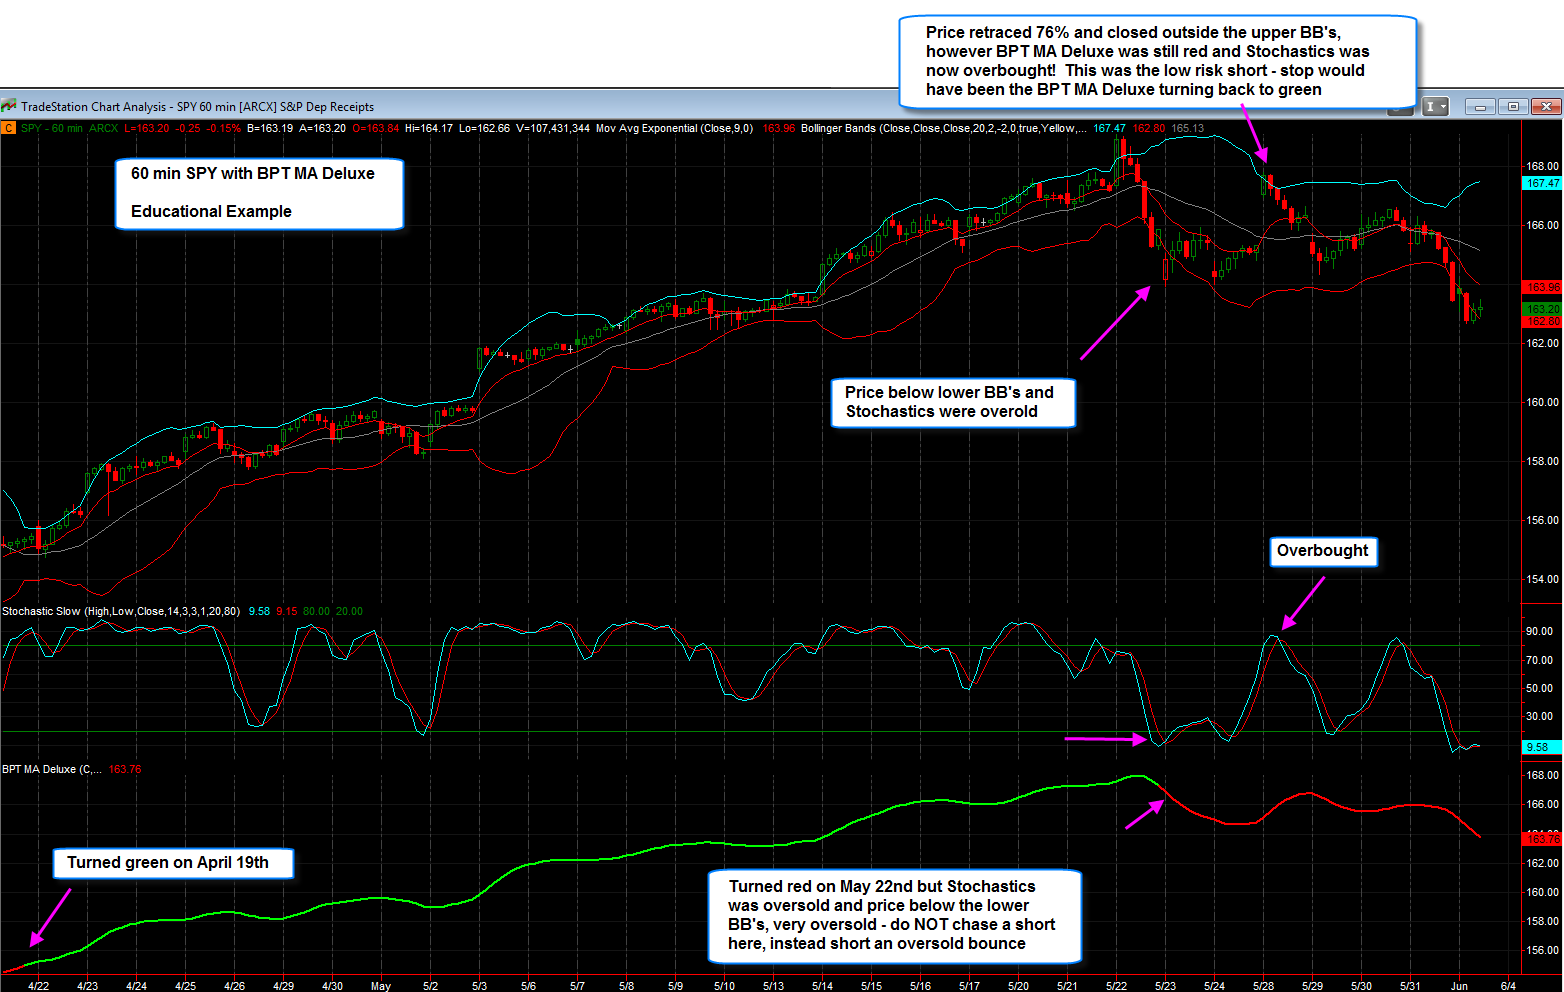
SPY 60 min with BPT MA Deluxe Educational Example
As you know I've been showing the BPT MA Deluxe indicator, which I've provided for free to members, however I've found that too many of you are treating this indicator as a system, which it is not; it's best to use it as a guide and a tool along with other indicators and price action.
Here's a great example showing a 60 min SPY chart and how using the BPT MA along with price action, Bollinger Bands, and Stochastics to get a MUCH more objective short trade when this indicator finally turned red on May 22nd
**CLICK HERE** to watch a short 5 min video explanation
Also see the attached detailed chart example with written annotations - these are the type of things that I would like to discuss in a future webinar on how to use this indicator.
DVY Mechanical System comments
DVY - Chart Link - taken quite a hit lately, logical because of the recent move in long term rates and bonds.
I bring this up because DVY is one of the Reversion to Mean systems in our 'Tradestation Systems' section of the website, it hasn't had a trade in a long time, since January.
This is a reversion to mean system using a standard 2 length RSI for the signals. However this one is more stringent, it needs the 2 RSI to close below 10% for two days in a row in order to take a position - therefore while the 2 RSI has been below 10% a couple of times recently, it hasn't had two consecutive closes below 10%.
Today if the 2 RSI closes below 10%, it will only be the first day - it still needs tomorrow to close below 10% as well in order to take a long position.
This system has 90% winning trades
Click here to View the Performance Report

Subscribe to:
Posts (Atom)