As you know, gasoline has been steadily rising at the pumps, for example the other day it cost me $72 to fill up my car. Let's take a look a the charts of Unleaded Gasoline:
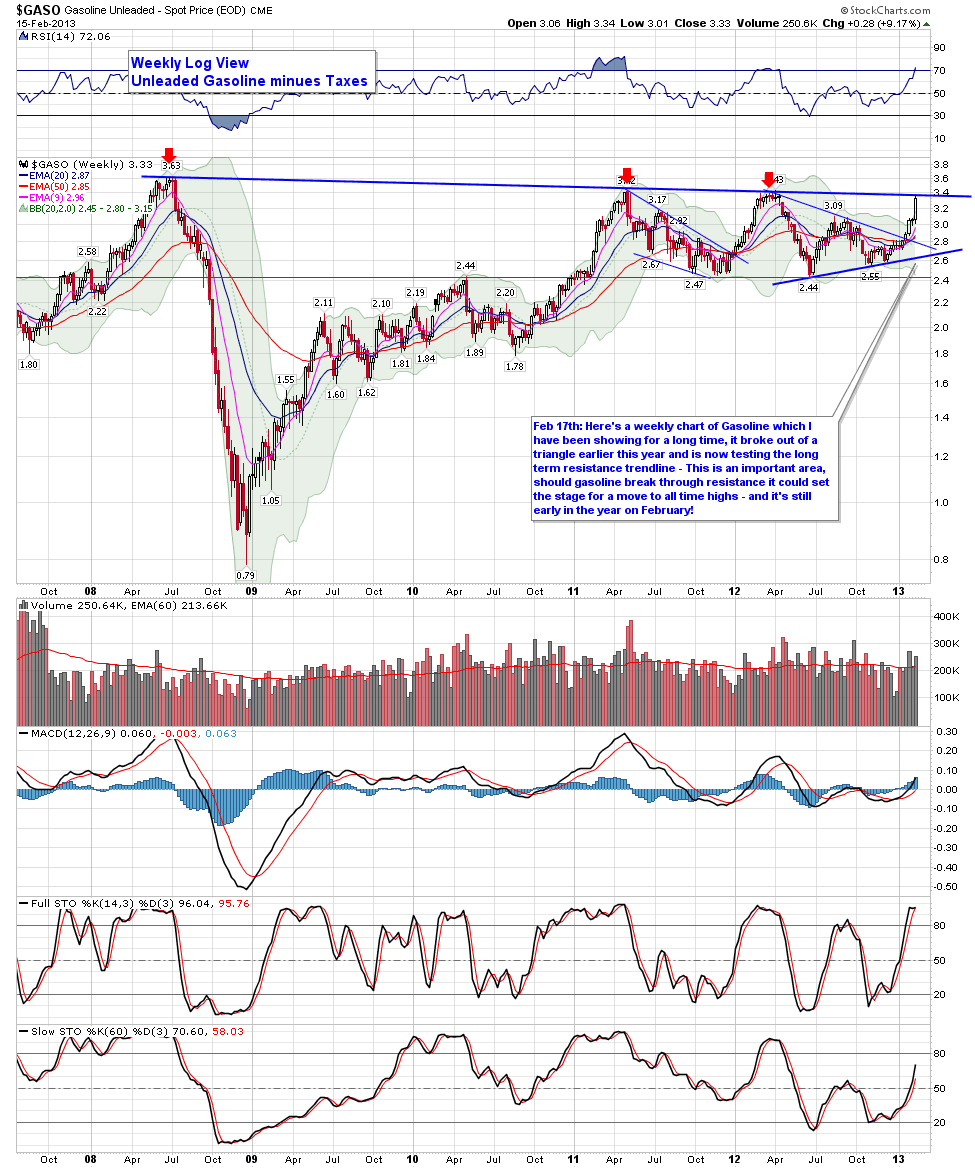
The first chart shows a weekly chart of Gasoline (minus taxes of course) which I have been showing for a long time, it broke out of a triangle earlier this year and is now testing the long term resistance trendline - This is an important area, should gasoline break through resistance it could set the stage for a move to all time highs - and it's still early in the year on February! However not that price did close above he upper Bollinger Band, thus it is overbought in the short term.
This is echoed on the daily chart as the RSI is sky high and there is a large gap - so it would not surprise me to see a short term pullback in Gas futures, however longer term the weekly chart looks quite bullish.

No comments:
Post a Comment