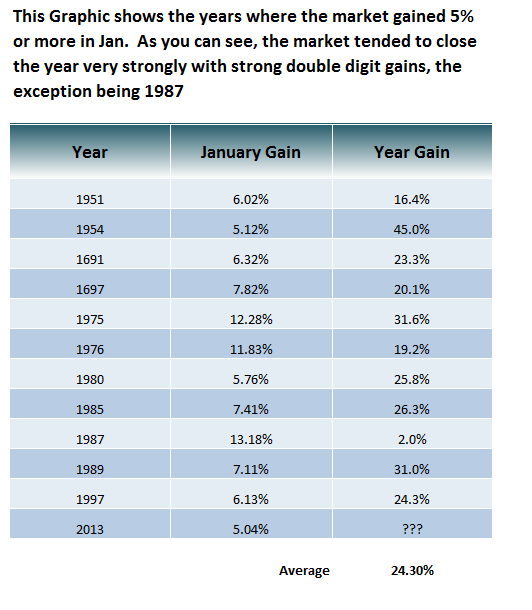
This Graphic shows the years where the market gained 5% or more in Jan. As you can see, the market tended to close the year very strongly with strong double digit gains, the exception being 1987 which still managed a 2% gain despite the famous 1987 crash.
On the flip side, this is also a post election year, where the market tends to struggle - I have not looked to see if any of the years listed on this table are election years.
Anyway just throwing the stats out there, obviously react to the market and what it gives you vs blindly following a statistic. Perhaps if we have another sell in May that could be a buying opportunity, but again we'll simply react to the market.
And of course regardless of what the market does long term, my long term SPX system will catch the big trends
No comments:
Post a Comment