Thursday, February 28, 2013
Wednesday, February 27, 2013
Our NYMO BB system gave a buy signal yesterday
Our NYMO / BB system gave a buy signal yesterday that clearly played out. As you can see on the chart, when the NYMO closes below the lower bollinger band, the market is generally do for a bounce and we clearly got that today with the SPX closing up 19 and the Dow up 175

BPGDM and gold stocks getting quite oversold and our system
The BPGDM (bullish percent gold miners index) is now 3.33%, that's extremely low, remember that a bullish percent chart can only trade between 0% to 100%, and rarely does it ever get to 0% or 100%, or even this low. Our mechanical system has been short since Oct 12th. When the system goes long we will let you know - this is a nice swing system.

Our GDX RSI 2 system closed out of its long ...
Our GDX RSI 2 system closed out of its long yesterday, it took a long last Wednesday. This is why you should consider becoming a member of Breakpoint Trades - because you will get these trade updates in real time!!
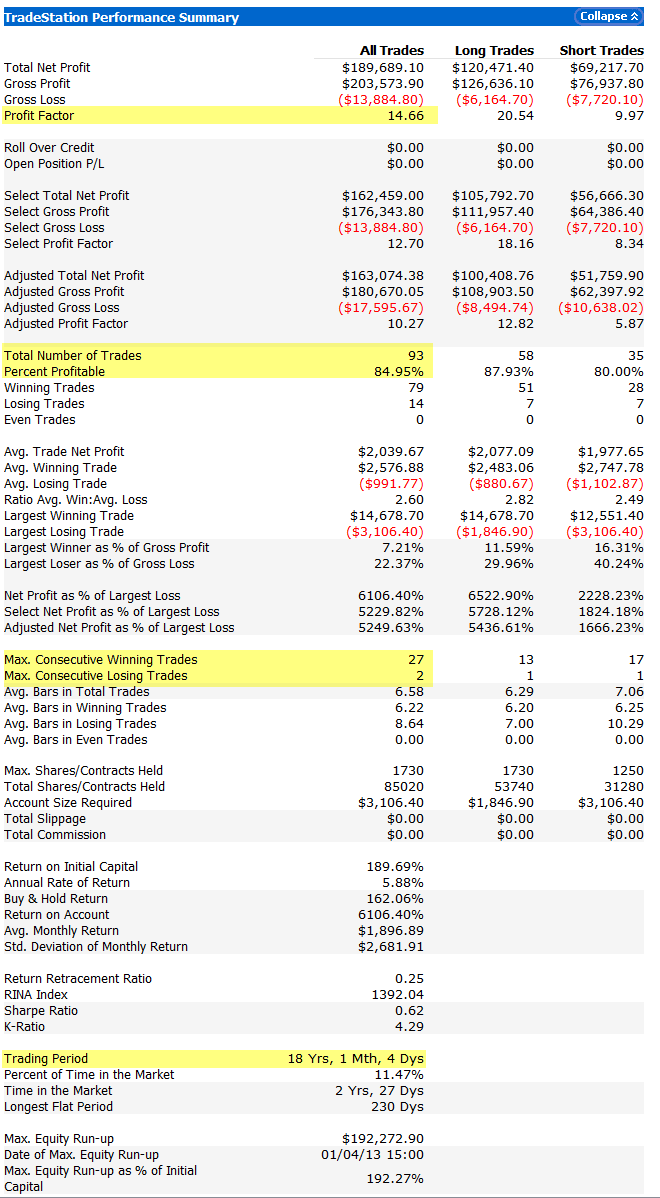
here's a performance report of the system so that you can view all the statistic
Otherwise, I'm not surprised, GDX simply bounced back to the 9 EMA where it reversed off


VIX buy signal worked
$VIX - Chart Link - VIX buy signal worked again, closed back inside the BB's yesterday, that was a buy signal per the system - see the rules on the chart

Tuesday, February 26, 2013
yep nice bounce today in gold, some some it's Because ...
yep nice bounce today in gold, some some it's Because of Bernanke - but again most of the time I've of the opinion that charts just play out and the news is only an excuse.
As I showed, the RSI was the most oversold in history on GLD last wednesday, so it was due for a bounce
also under this weekly wave count, gold needs a bounce as a wave (b), so maybe this bounce is that.


Monday, February 25, 2013
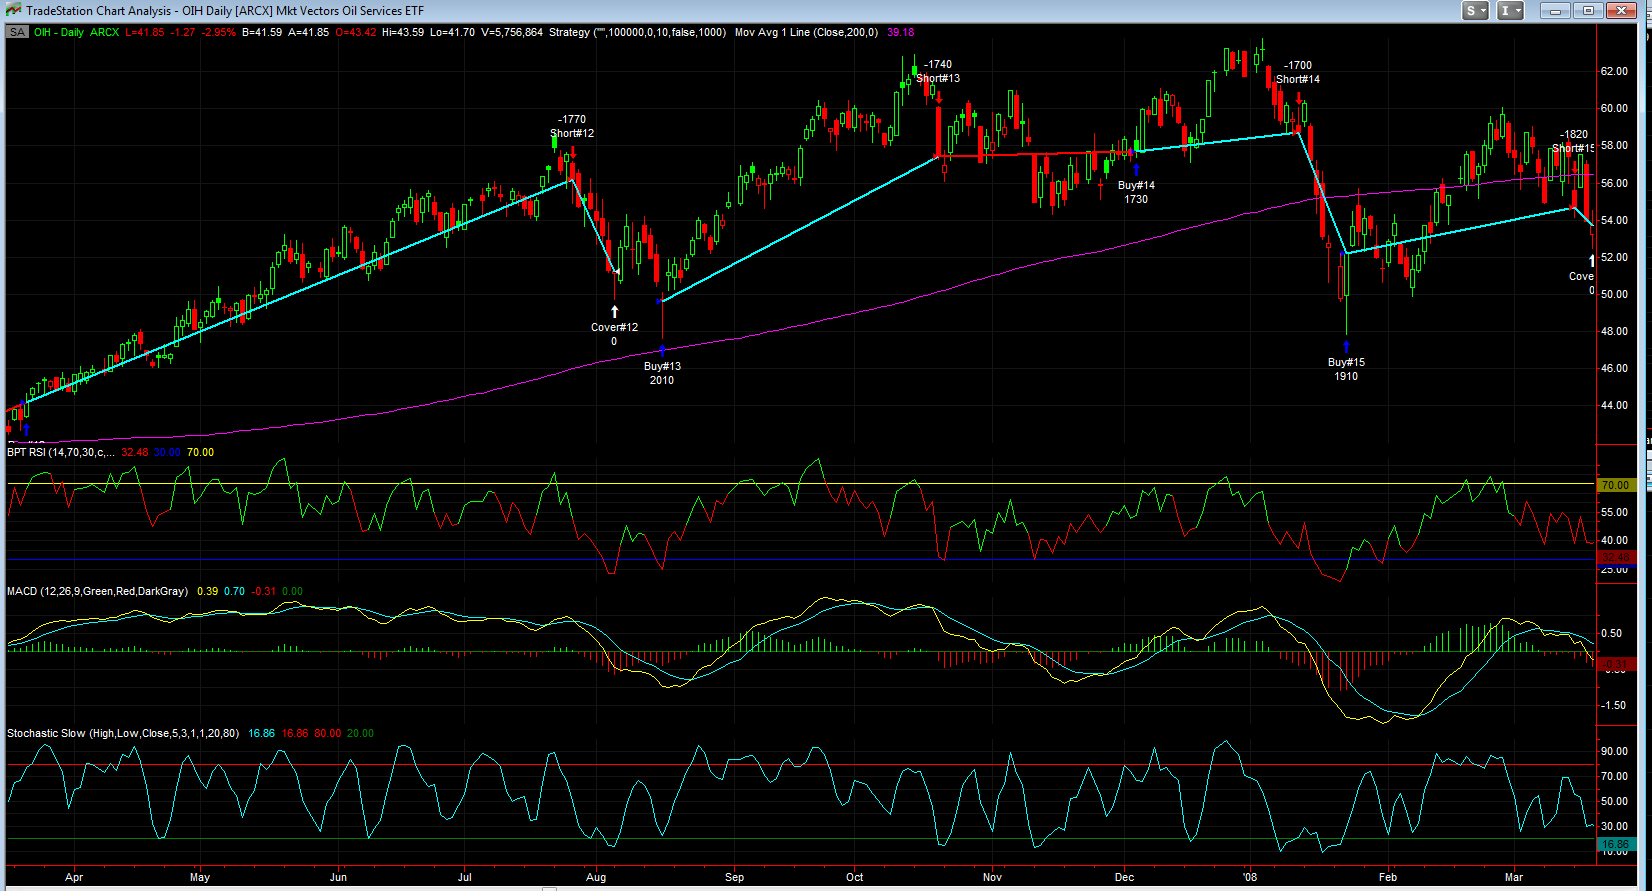
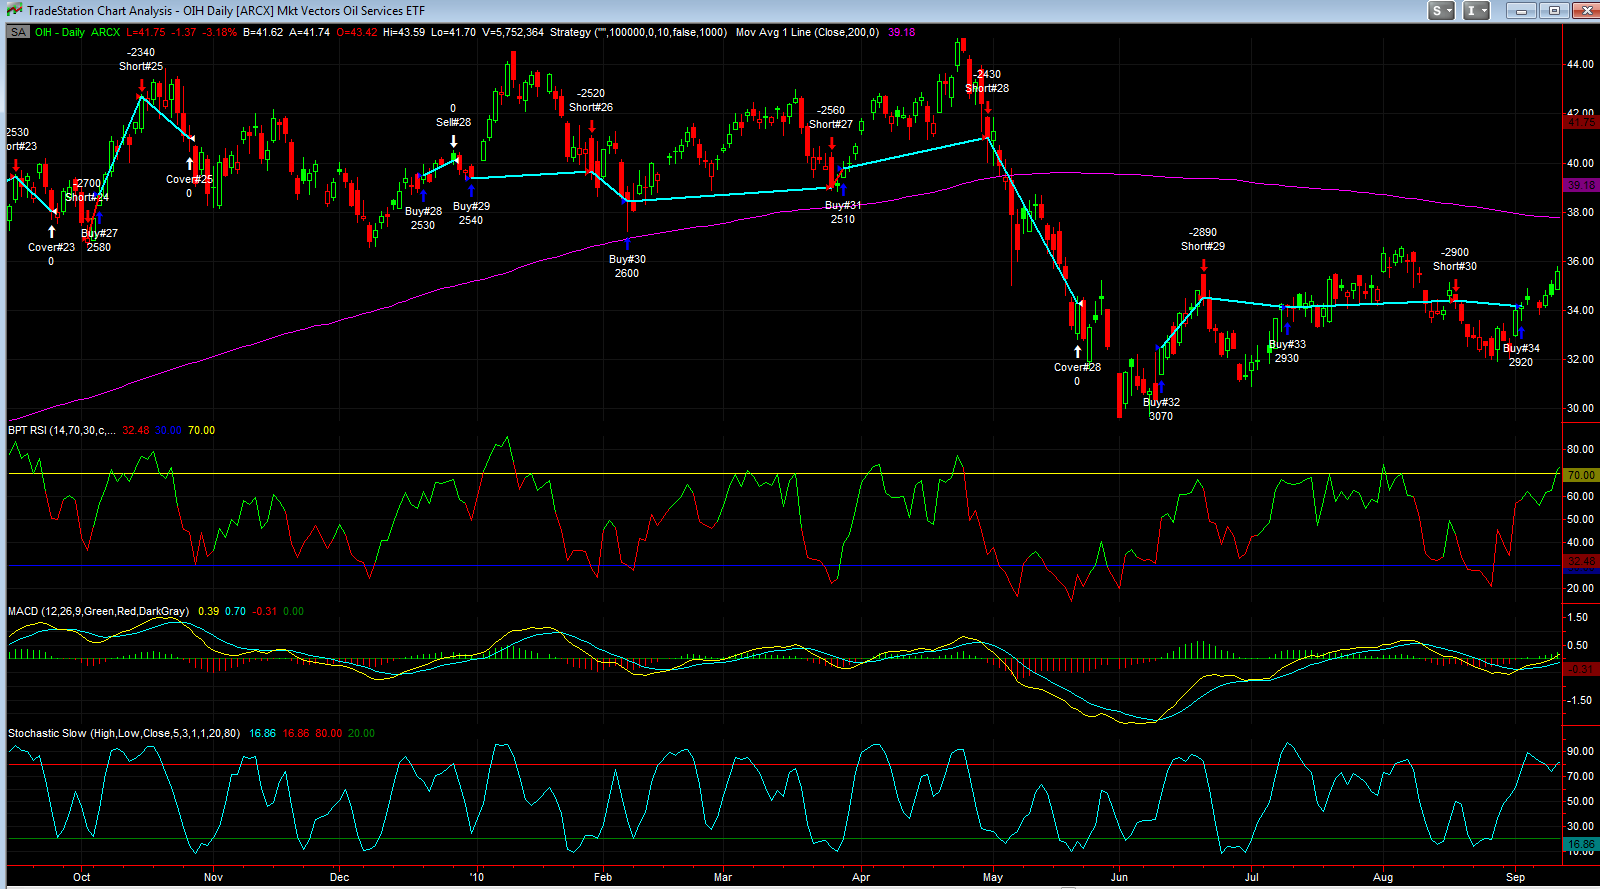
here's some charts showing trades of the OIH/XLE BPENER system
here's some charts showing trades of the OIH/XLE BPENER system


SPY Ver 2 system follow up
As a follow up to my post last Friday, the SPY Ver 2 system which went long last Wednesday and Thur is doing well so far - a trade signal email was sent out last week.
All the market has to do is close slightly up today and this system will get an exit signal - however it will exit tomorrow on the open and not at the close today - all longs for the SPY Ver 2 system are exited on the next day open vs the close of the day (make sure to read the overview tab for this system). This is explained in the Tradestation Systems section in the overview tab for this system. Remember these are reversion to mean systems, they are not trend followings systems, i.e. they buy pullbacks in uptrends and short rallies in downtrends - they mostly get in a trade and get out fairly quickly, once in a while they will hold a trade for a couple months but most of the time they are in and out fairly quickly and ONLY in the market about 25% of the time. This allows you to have your money working somewhere else the other 75% of the time
click here to read about about the SPY Ver 2 system, and here's the full Tradestation Performance report showing all the trades and detailed stats. Also make sure to read the Overview Tab in this section, which explains the systems in general.
The other reversion to mean systems didn't take the long trade (SPY RSI 2, DVY RSI 2) etc because they needd a deeper pullback. Only the SPY Ver 2 went long.
I will be setting up a Webinar soon to discuss the systems and trades in detail.
click here and submit your email to get on our list - I will send out an email in the future to notify you.

Sunday, February 24, 2013
NYMO oversold system
I was not surprised to see the market bounce last week on Thursday and Friday since our NYMO indicator closed below the lower Bollinger Bands on Wednesday, as you can see from the chart, this has generally produced a bounce for the market. However I have some doubts that the market correction is over just yet, we'll see..

Friday, February 22, 2013
Thursday, February 21, 2013
XLE vs OIH for XLE system
OIH - Chart Link - XLE is down -2.44% today vs XLE down -1.2%
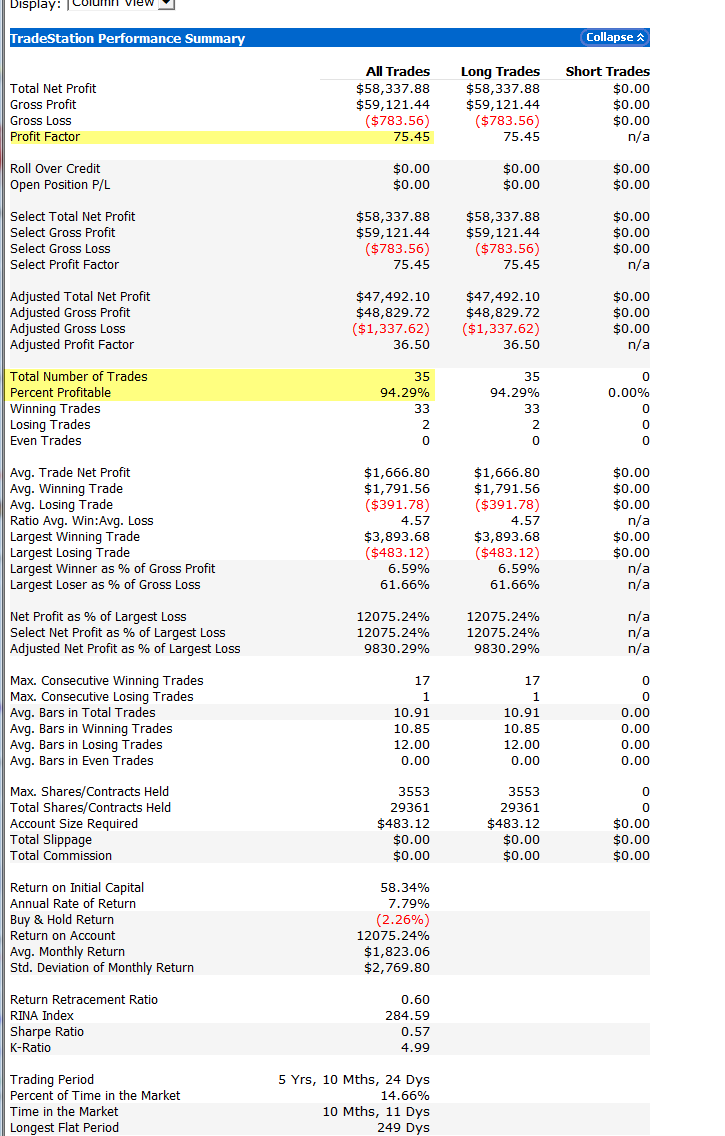
Again as I've shown before, trading OIH in place of XLE has made about 25% more profit vs trading XLE. Here's the trade statistics - all trades dates are the same. 100K was used for each trade and no compounding was used to keep things simple. XLE made 570% since 2005, whereas OIH would have made $705K.
XLE Detailed System Report (note this file will only open in Internet Explorer)
OIH Detailed System Report (note this file will only open in Internet Explorer)
I don't use compounding, but if compounding is used, 100K on OIH from 2005 turns into $46 million LOL, here's that report
Wednesday, February 20, 2013
GLD and RSI
The RSI 2 and 14 RSI are the most lover sold they have ever been since GLD began trading.
14 RSI closed at 18.66%, RSI 2 closed at 0.15%.

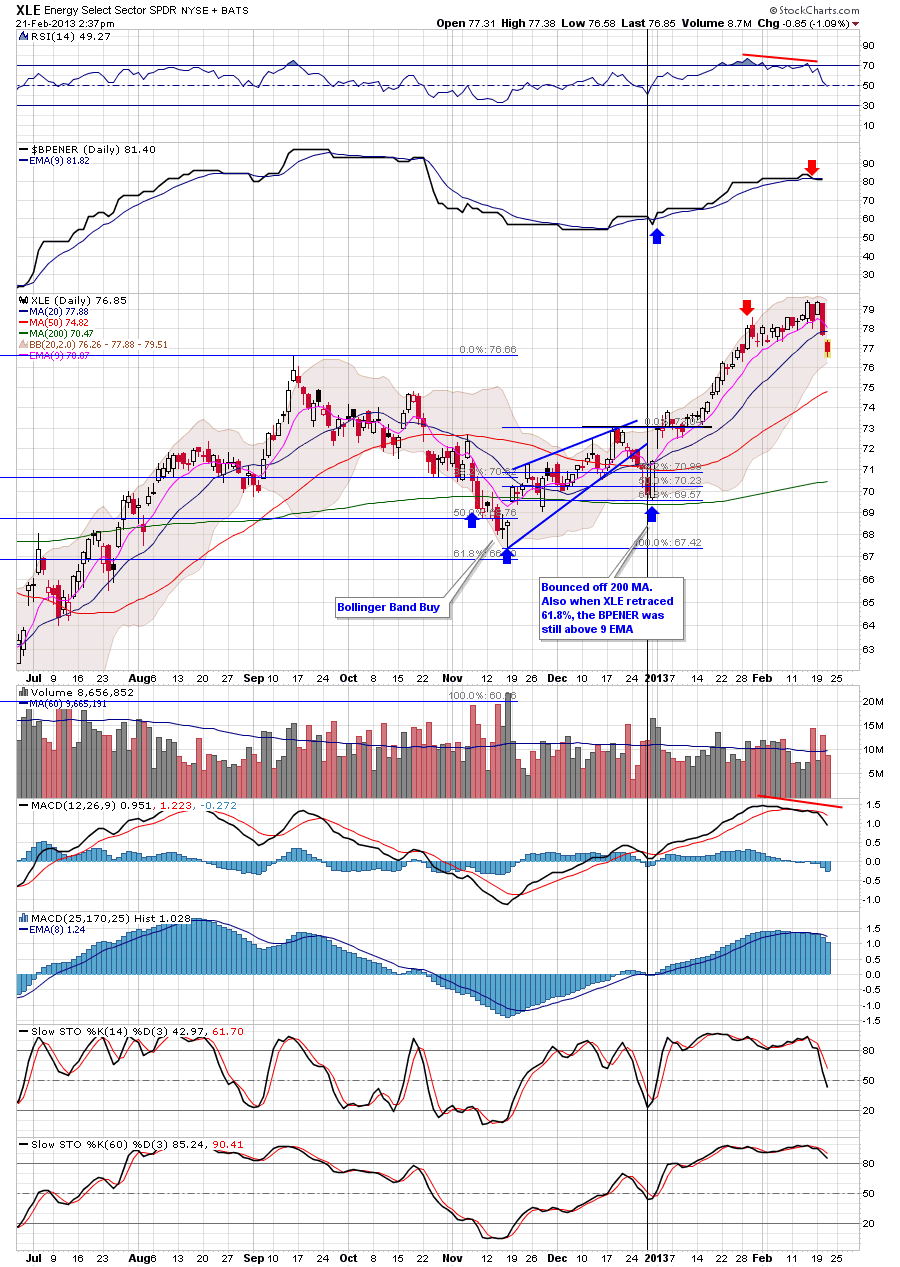
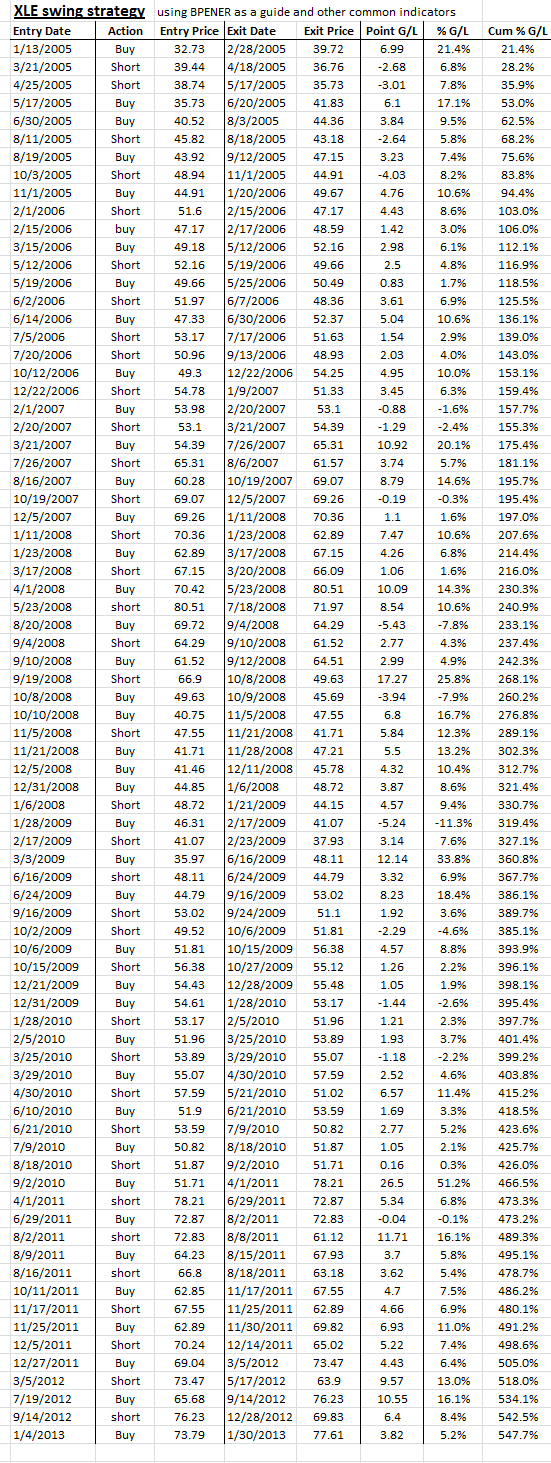
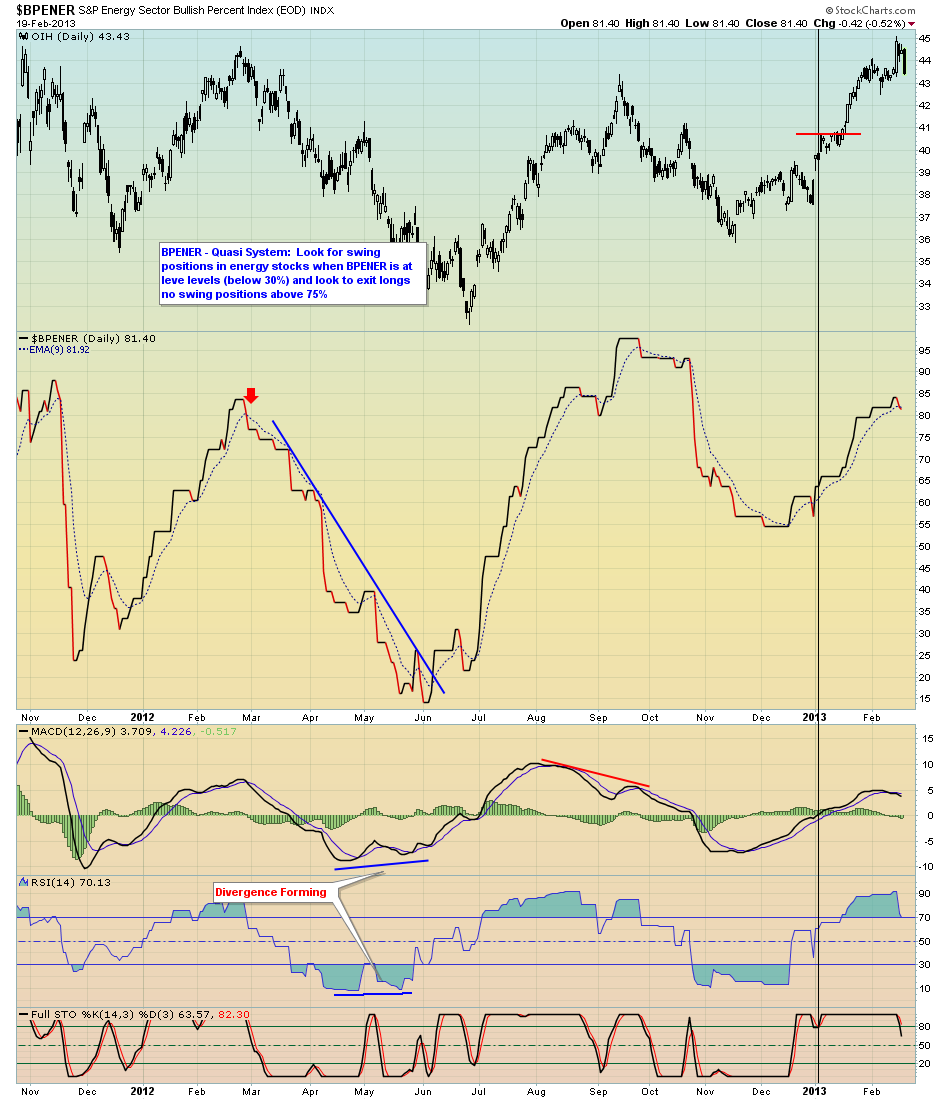
XLE / OIH BPENER swing system
As you know, the XLE swing system took a long trade from Jan 4th to Jan 30th for a very nice 5.2% trade, the system then went to cash and has been sitting in cash since. However some of you may have taken an aggressive short, if you still have that short it's finally starting to look better.
Otherwise it appears that today at the close the XLE system will take a short position. I've attached the XLE swing system trades to this email as well as the BPENER chart.
Otherwise even though this is the XLE system, one thing that I have commented on in the past is that it has been more profitable trading OIH or XOP in place of XLE. Here's a link to two Tradestation Performance reports which show the XLE system and a version if you traded OIH in place of XLE.
XLE Detailed System Report (note this file will only open in Internet Explorer)
OIH Detailed System Report (note this file will only open in Internet Explorer)
GDX RSI 2 quite oversold now
As you know gold and GDX have been pathetic and we have been on the right side of the trade here.
However in the very short term they could be getting oversold.
Currently the RSI 2 is at 1.80% on a daily GDX chart which historically is quite oversold. If GDX was above teh 200 day MA, the changes odds of a bounce would be 100% based on historical trades. However the GDX is currently well below the long term 200 day MA and is in a strong downtrend. So what are the odds for a short term bounce? I tested this with my RSI 2 Reversion to the mean system code and here are the results:
Here's a link to the Performance Report showing detailed Statistics
system rules:
Go long GDX when RSI 2 closes below 2%
Exit the trade when RSI 2 closes back above 80%, or hold the trade for a longer period of time if our momentum indicator is positive.
the system scales into a trade in a total of 3 scale-ins of 40%, 30%, 30% - each scale in has to be at a lower (better) price than the first entry.
The results are quite positive - 93% of the trades were winning trades with the largest losing trade at 1.2%. However that said - some of the trades had to take some heat before working out - particularly the times when GDX was really in a strong down trend, many times you got lower prices before GDX finally bounced.
Again I'm posting this for informational purposes only.
My students who have the Tradestation Systems - already have this system and others on their computer
Note: The RSI 2 must stay below 2.2% by the close in order for this system to take a long


Tuesday, February 19, 2013
Tuesday Feb 19th Market Newsletter
Hello Folks - the last newsletter I posted was our commodities newsletter, here's our general market newsletter. This newsletter also contains a ton of trade ideas, about 20
Tuesday Feb 19th, 2013 Newsetter
Also be sure to check out our coupon for 20% off our 6 month membership!!
Best to your week!
Matthew Frailey
TBT trade comments
TBT - Chart Link - TBT was a trade idea back in Jan as a low risk entry near the trendline support. It is trying to bounce off the 20 MA again.
TBT - Chart Link - here's a daily count offering both a very bullish wave count (noted in blue) as a sub dividing 5 wave pattern or a corrective ABC move (noted in black), however even under the ABC corrective move it should still make a new high as a wave C
TBT - Chart Link - here's a 60 min chart, set up into a nice triangle pattern - one could buy a position now with a tight initial stop placed just below the lower trendline of the triangle
TBT has been correlated to the market has relates push high along with the stock market


Monday, February 18, 2013
Comprehensive Commodity Newsletter
Here's my most recent commodity newsletter - this one is pretty in-depth, so please take the time to review
Matthew Frailey
Gasoline Analysis
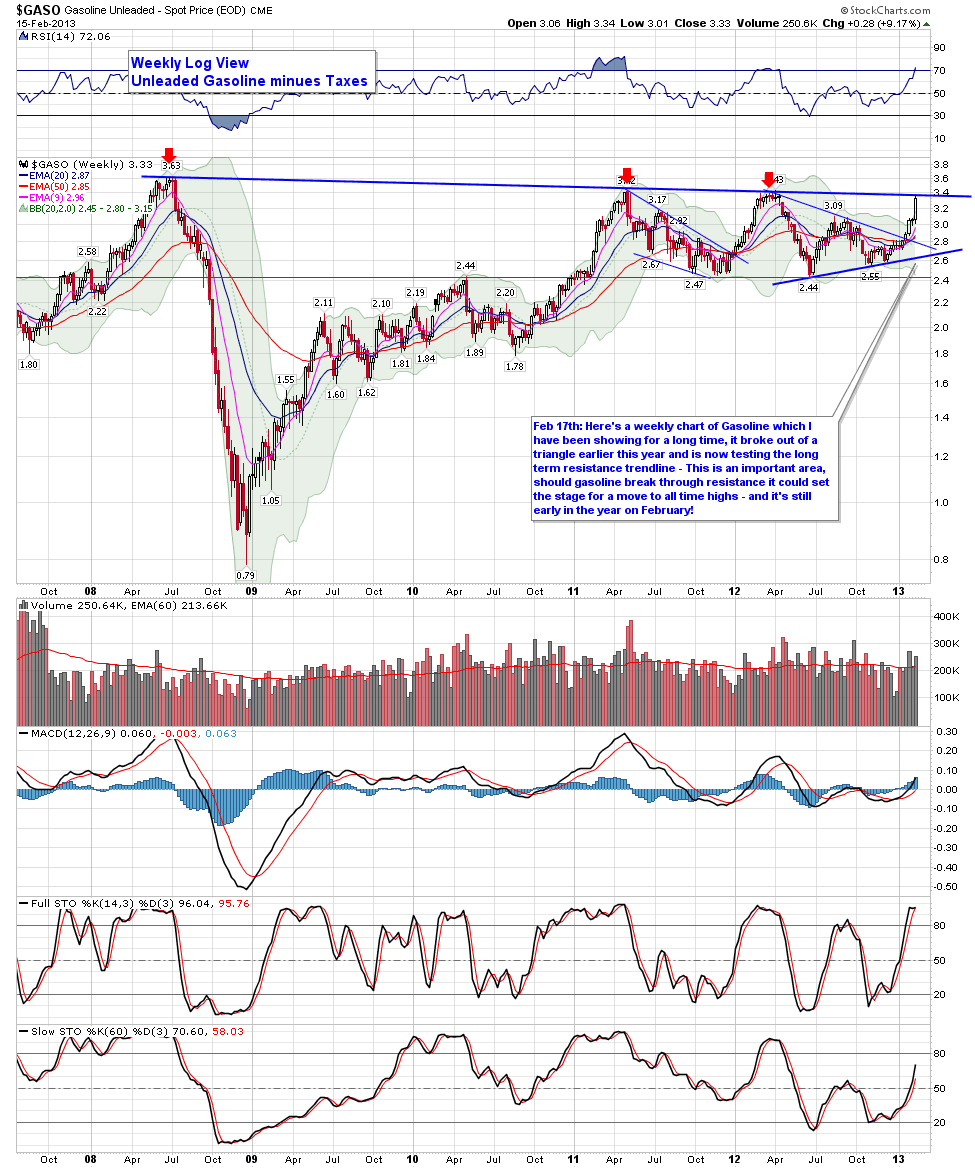
As you know, gasoline has been steadily rising at the pumps, for example the other day it cost me $72 to fill up my car. Let's take a look a the charts of Unleaded Gasoline:
The first chart shows a weekly chart of Gasoline (minus taxes of course) which I have been showing for a long time, it broke out of a triangle earlier this year and is now testing the long term resistance trendline - This is an important area, should gasoline break through resistance it could set the stage for a move to all time highs - and it's still early in the year on February! However not that price did close above he upper Bollinger Band, thus it is overbought in the short term.
This is echoed on the daily chart as the RSI is sky high and there is a large gap - so it would not surprise me to see a short term pullback in Gas futures, however longer term the weekly chart looks quite bullish.

Friday, February 15, 2013
Gold getting hammered - not surprised
GLD - Chart Link - Gold getting hammered today, not surprised though because if you listened to my recent newsletters, you heard my warning. Otherwise this GLD chart broke down nicely and is nearing the lower target inside the channel.
$GOLD - Chart Link - however longer term this weekly chart shows major support near the 1525 - 1535 range - large descending triangle - if you are a 'gold bug' you do NOT want to see gold lose that lower support area because the pattern measures about 275 points, which would take gold down to a target of about $1250! Otherwise for now gold is still above that support
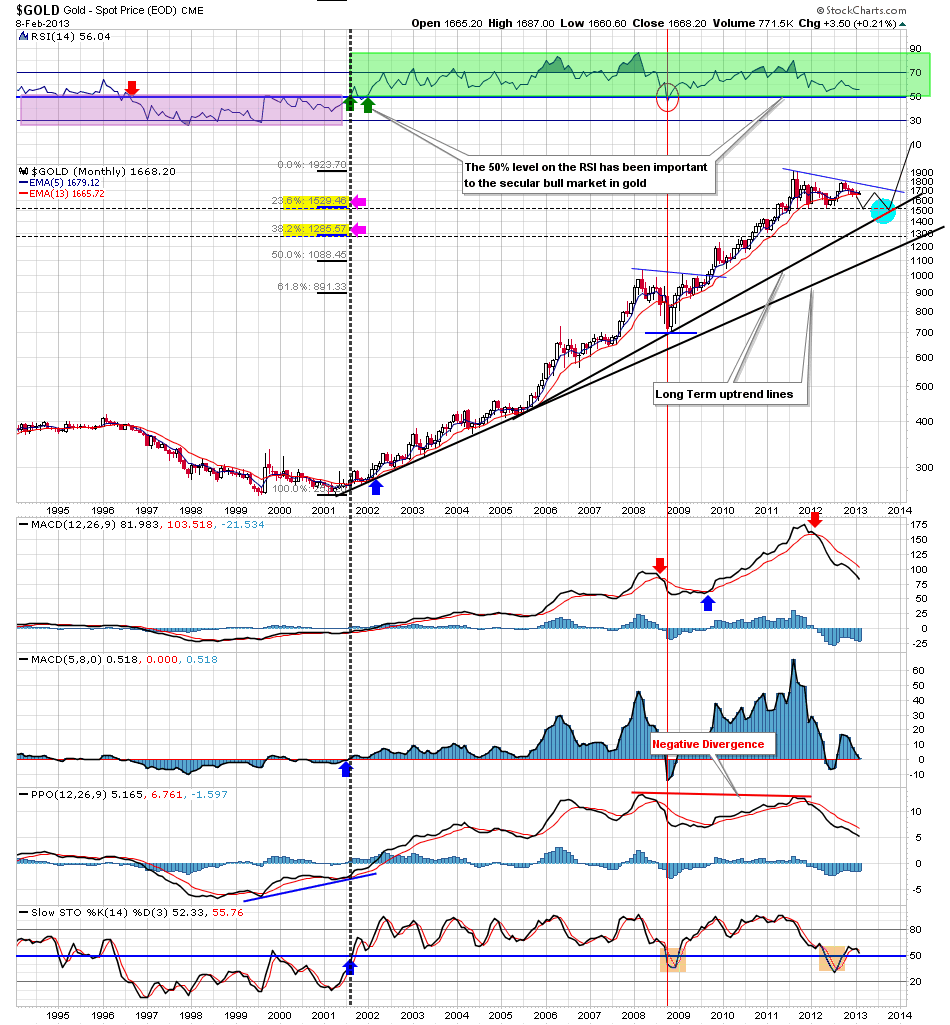
$GOLD - Chart Link - lastly here's my monthly chart of gold - if you've listened to our newsletters, I've said that I would not be surprised to see gold eventually test one of these long term uptrend lines. Also keep an eye on the 14 RSI indicator at the top of this chart, clearly that 50% level is very important.
otherwise regardless, I'm not gonna hold out for a specific price to be met - I'll react and adjust to the charts as they develop. I'll also monitor the COT data and if the Net Short falls below 100K, that would mark a significant bottom IMO.


Tuesday, February 12, 2013
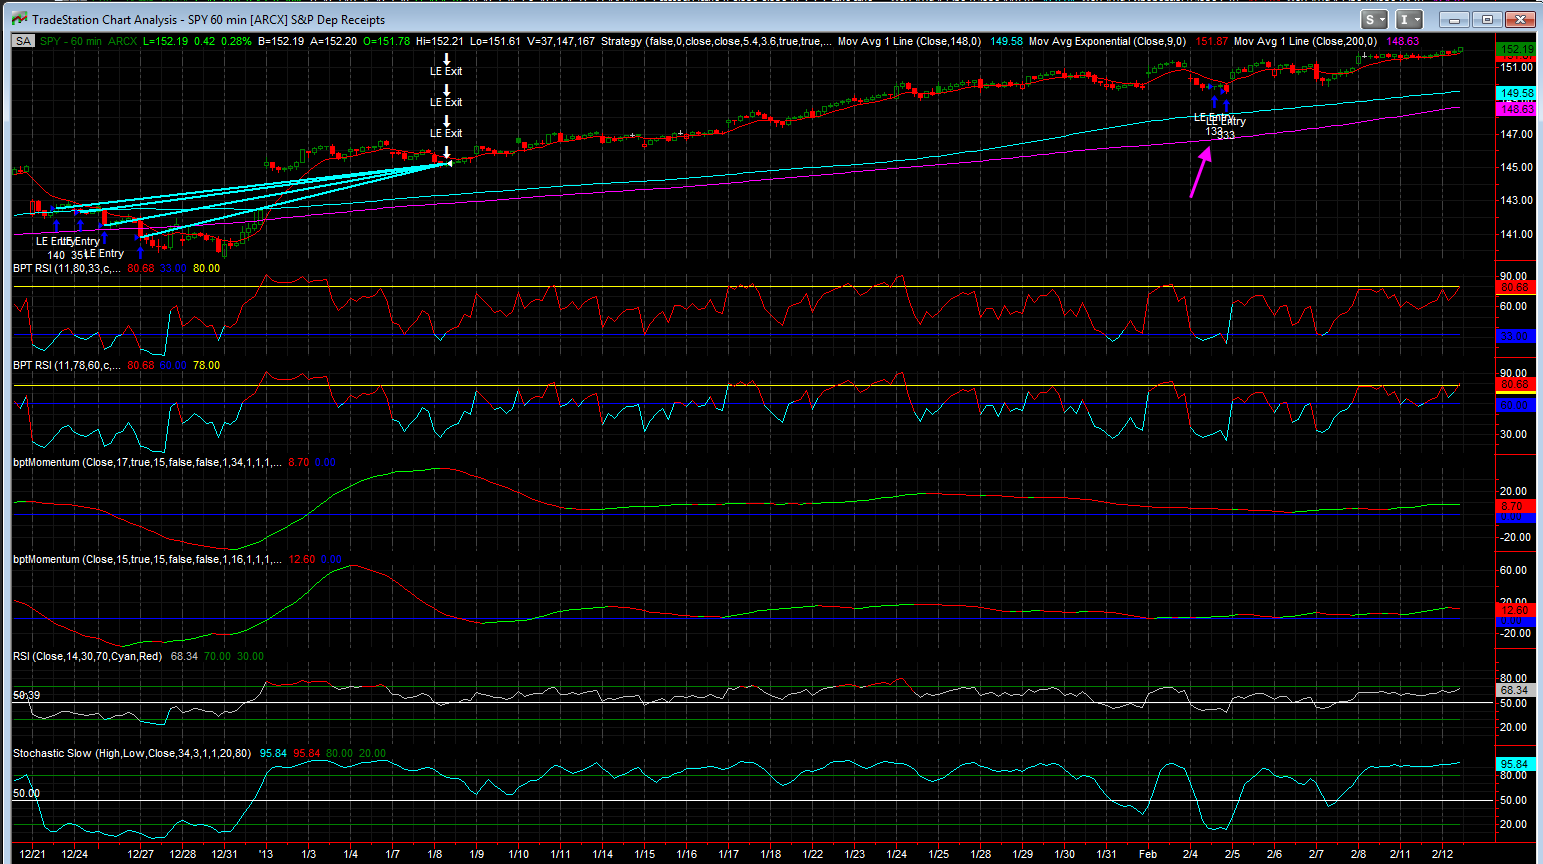
Systems
This ES 5 min system has been killing it the last few days - it doesn't hold overnight, only day trades. It uses the same code as the daily systems from the 'Tradestation Systems' section of the website
also note while the daily systems have not taken any new trades since Jan (since the market has not pulled back enough), the 60 min SPY version did take a Long on Feb 4th and is still in the trade, nice one so far
If you are interested in these systems, you can enter your email on the waiting list on the Tradestation Systems' section


Our Recent Newsletter
Here's our most recent newsletter - tons of charts, market analysis, also check out my long term systems for the Dow and SPX! Also see my big picture charts for gold.
Also it has come to my attention that quite a few of our charts are being used without our permission at a twitter account - here's the twitter account which has been taking our charts and posting them as his own
https://twitter.com/Equitykingkong
I don't mind folks re-sending our charts - however please give credit and cite your your source when you do,
thanks
Monday, February 11, 2013
Gold long term
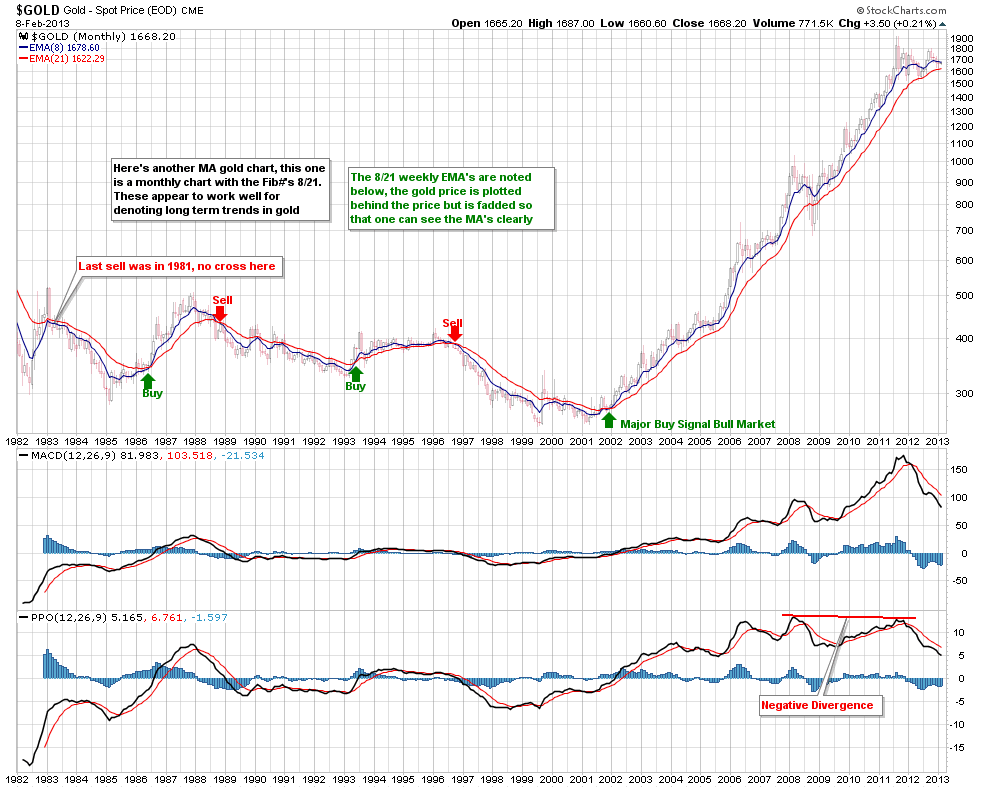
$GOLD - Chart Link - longer term, gold bugs probably don't want to see these MA's cross down - again they are not close to doing so and will take a long time, however it's something to monitor long term
$GOLD - Chart Link - and of course you really don't want to see the 14 RSI have a confirmed close below the 50% level on the monthly.
Steve and I try to be objective about Gold and we will tell if it's bearish or we think it's going down. One problem that I have with 'Gold Bugs' is that they always think gold is going up no matter what, and when goes is not going up, it's a conspiracy! The world banks are shorting it, and holding it back etc etc. It's like come on guys, we cannot quantify that, you cannot get buy and sell signals from that data - that's why I focus on the charts, the charts do not lie.
There will be a day to sell gold - it's secular bull will not last forever. Personally I still think it has one more up cycle in it's secular bull - but I could be wrong and of course one day it will end.
Gold comments
$GOLD - Chart Link - gold down nicely once again, down -$17 this morning. Again the action from last fall and this year is lending more credence that gold may have that longer consolidation as I've discussed before - perhaps until Aug or to test one of the long term uptrend lines. The peak in 2011 resulted from a much longer run than the previous rallies and thus it would make sense for this consolidation to last longer than the previous ones, also gold tends to be dead money from about May into the summer.
GLD - Chart Link - daily chart - well see if it breaks down into the lower channel once again


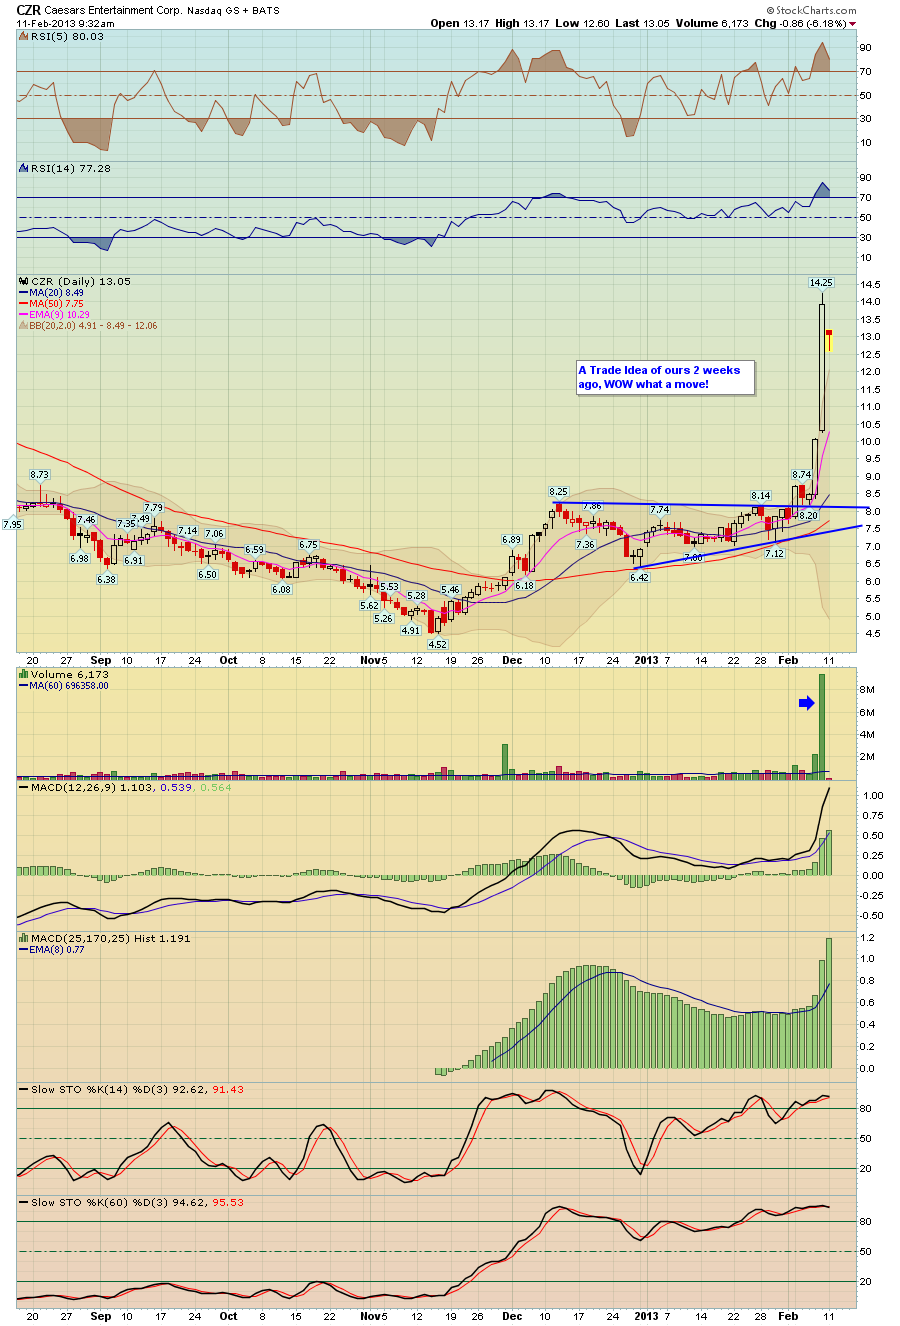
CRZ trade idea follow up
Besides top notch market analysis, we also give tons of short term trade ideas each day in our intra week newsletters, 2 weeks ago CRZ was a pick of ours, Wow what a move!
Saturday, February 9, 2013
On Friday I posted some key market statistics for how ...
On Friday I posted some key market statistics for how the market tends to close out the year if it has a great January and a 1st quarter. Over the weekend I cleaned up the charts and added new statistics. Since we are now in Feb, I added the Feb gains to the strong Jan table. I've heard traders state that if the market has had a strong January, then February is typically a weak month - however the statistics do not show any correlation.
I also add the Presidential Cycle statistics to both of the tables as well as some key statistics to the quarterly table, which is sorted by years where the market closes up for the 1st quarter.
Anyway take a look when you have time, my thoughts are to add these tables to the Long Term Tools section of the website, as well as lots of other statistics such as the Sell In May and Go Away etc.


Friday, February 8, 2013
Follow up on AAPL
AAPL - Chart Link - AAPL is about $40 point s off the lows, and for now has bounced off the weekly long term uptrend line from 2003, which we pointed out when it occurred
AAPL - Chart Link - here's a daily view - Once AAPL starting to get into the earnings gap, it was logical for it to push higher - however notice that it has tested the 480.58 low from early Jan, which for now is acting as resistance, otherwise if this can be cleared the downtrend line is your next resistance point.
One thing to note; the MACD now has a positive cross, so this confirmed the divergence at the low
AAPL - Chart Link - here's a 30 min view, which I showed earlier in the week and a potential bullish W pattern which I also discussed - you can see the resistance low from Jan 15th


