Monday, April 29, 2013

Here's a Mechanical SPY daily system that wins 96% of its trades!

Hello everyone, as you know the market is once again testing it's all time highs from 3 weeks ago with the SPX near 1600!

However here's an mechanical system that I developed a while back, it's a daily swing system based on the SPY ETF, which is the 1X ETF for the S&P 500.  This system is a reversion to mean system, which means that it buys pullbacks in uptrends and shorts rallies in downtrends, however it also has a trending component to it which allow it to hold trades for longer periods of time when the indicators line up.  Also this system has a scale out component to it which helps to reduce risk and increase the winning percentages.

Key Statistics:

- This system has 95.8% winning trades going back 18 years on the SPY.  

- 714 total trades with 684 of those winning trades and only 29 of them losing trades

- 109 consecutive winning trades

- profit factor of 20.5, which means that for every 1 dollar it lost, it made 20.

Here's a URL to the full Tradestation Statistics Performance report, which lists all the key statistics, trades, etc

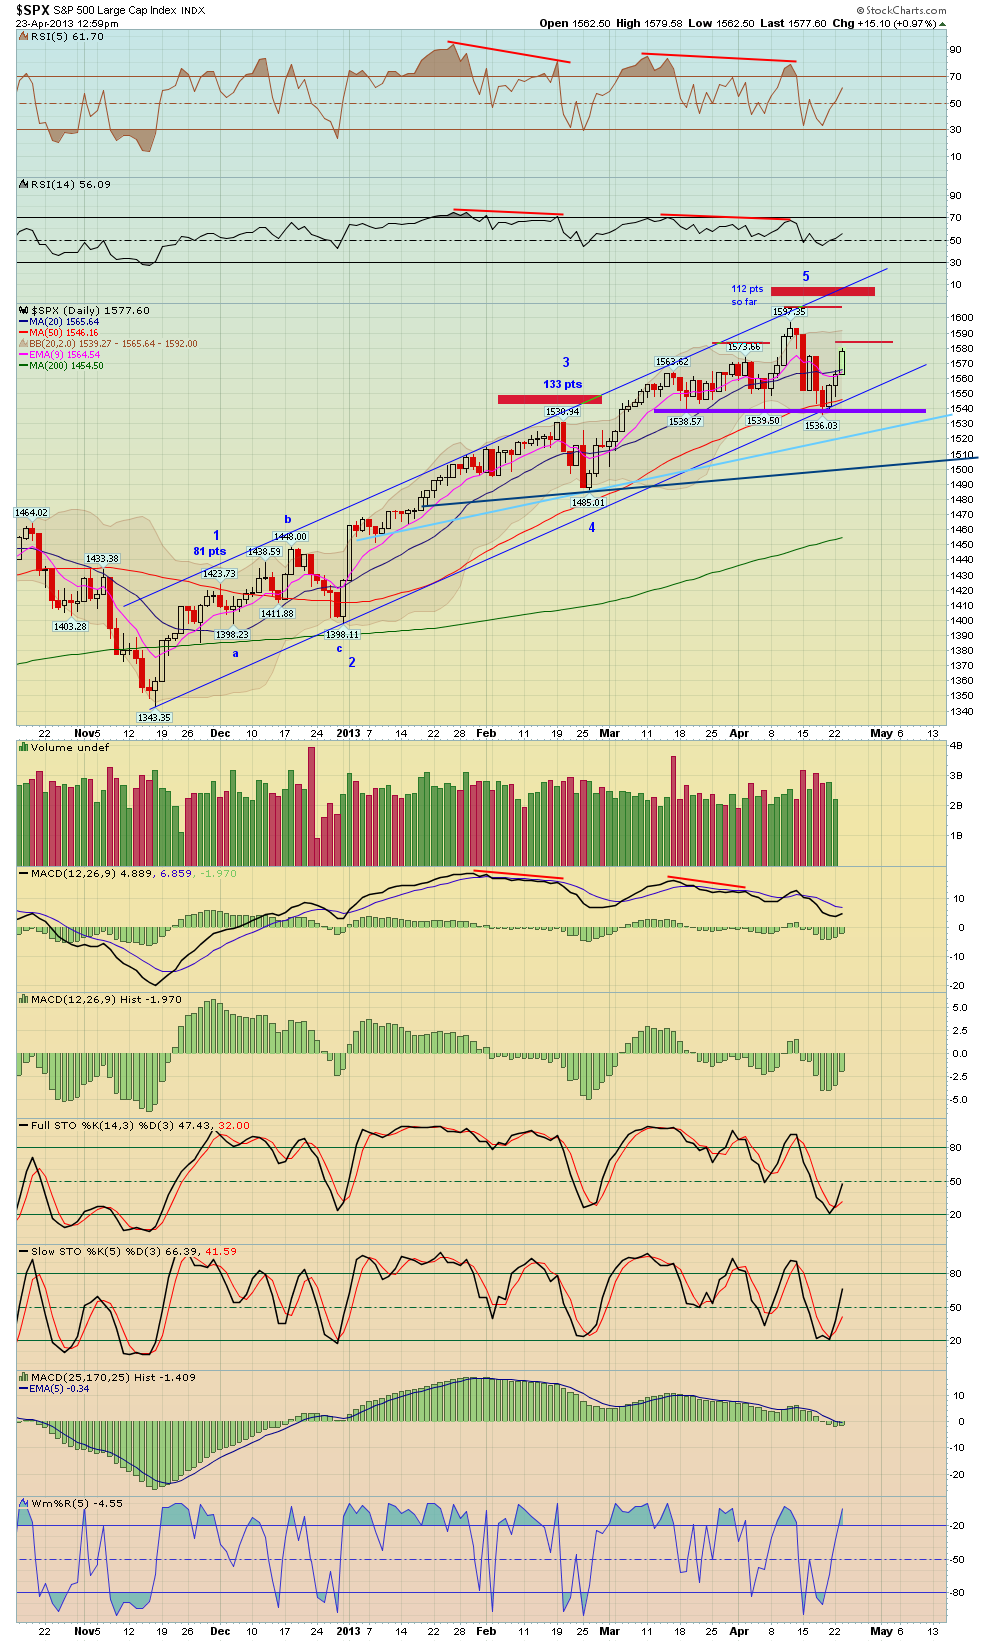
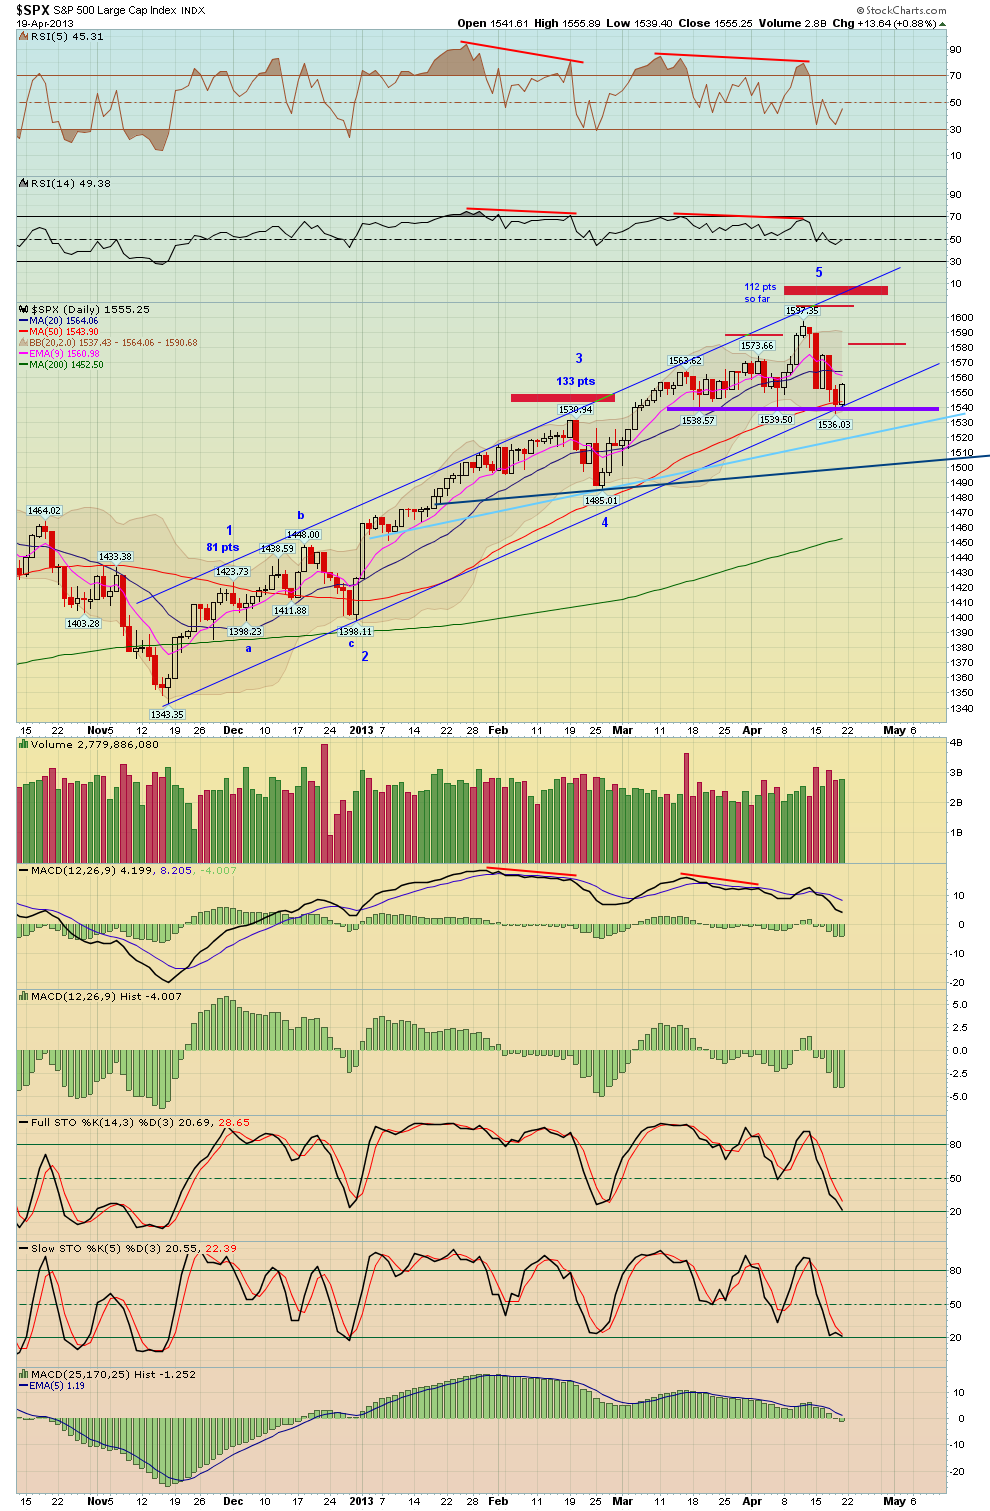
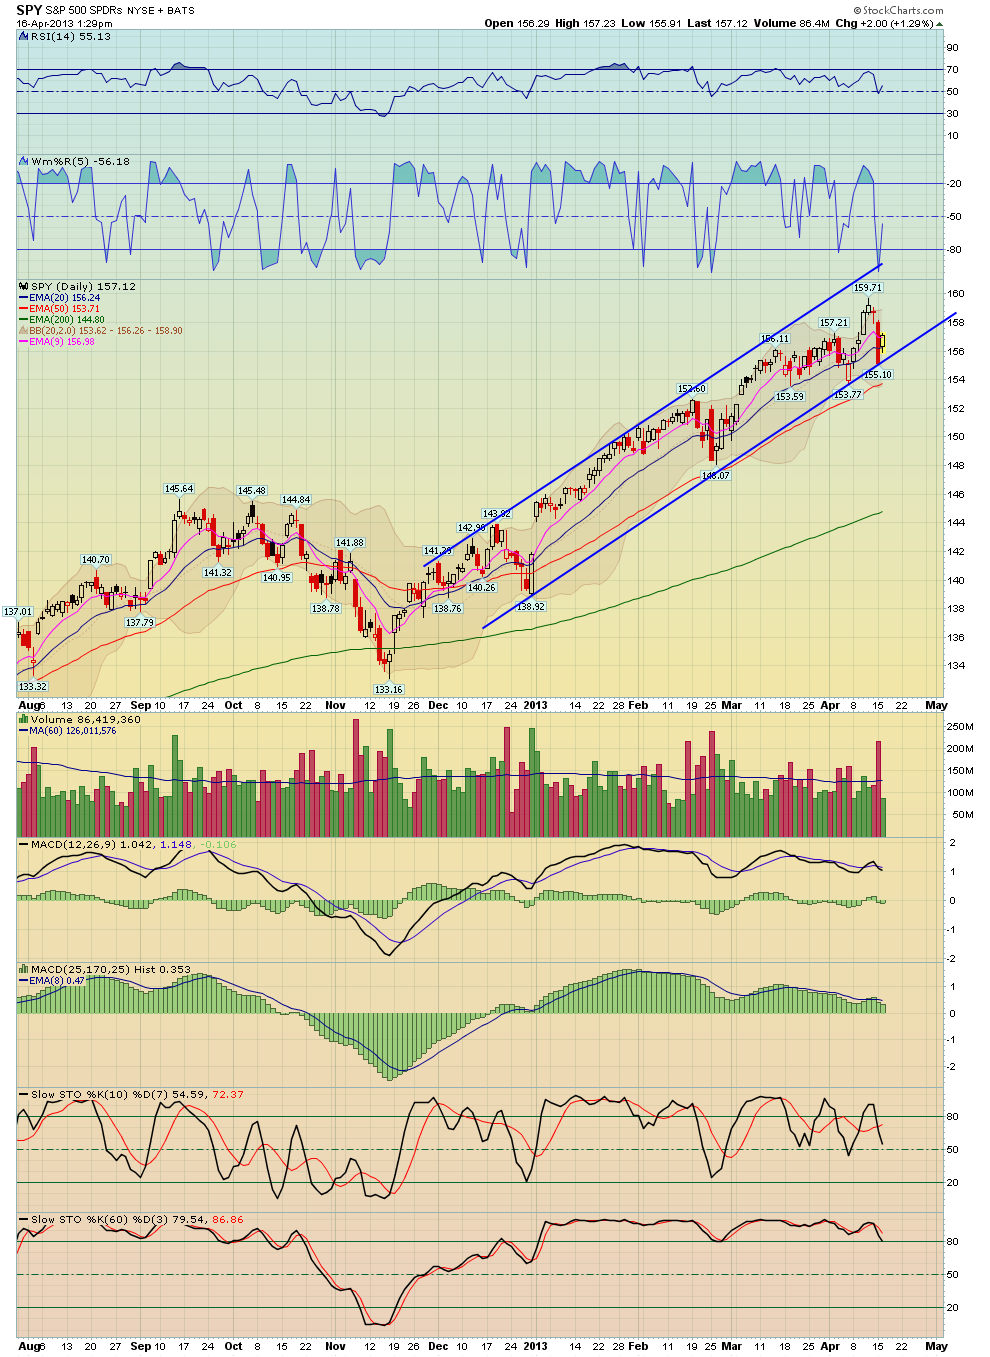
The system went long 2 weeks ago on April 18th and exited it's long trade for a nice winning trade!

I've also attached the chart showing the recent trades as well as a few key statistics

If you are interested in this system, you should join up for a subscription to Breakpoint Trades, our 6 month membership is our best deal at the moment.  Our members get trade signals to this system as well as others emailed directly to them.

Also here's a 20% off membership coupon code (705DD97275), however please note that this coupon expires in 5 days, so hurry!

Sunday, April 28, 2013

Commodity Weekend Newsletter for April 28th, 2013

I hope everyone had a nice weekend!


Here's my commodity weekend newsletter, it's VERY comprehensive containing about a 40 min audio overlay with over 60 charts.  Please take the time to review, I think this is one of my better newsletters


CLICK HERE to view the newsletter


Good trading,


Matthew Frailey

Other Gold Charts

Here's other gold charts of interested:

GLD gold ETF, perfect gap fill!

As you know Gold has rebounded off the lows from 2 weeks ago, on Friday GLD perfectly filled the large gap down from April 15th - this was a logical target.  


However don't expect gold to go straight up, I think a pullback will occur fairly soon, which will either form a higher low, or a lower low.  Let's see what happens this week!

Thursday, April 25, 2013

Here\'s Our latest Newsletter

Here's our latest newsletter on the market, some commodities, and stock picks

CLICK HERE to view the newsletter

Gold stocks are up again, here's a video update on their progress and what I'm seeing


Here's a 5 min video update on Gold stocks and GDX


Wednesday, April 24, 2013

GDX looking more interesting and BPGDM may give confirmed buy signal

The BPGDM Bullish Percent Gold Miners Index may give a confirmed buy signal today as long as GDX does not sell off in the afternoon and holds its gains.  Initial targets would be the gap fill from April 15th and the 20 day MA, however please watch the video for more detailed discussion


here's the video

Tuesday, April 23, 2013

Market up nicely again, follow up to my market post from Thursday

Last week on Thursday the market was down strongly and folks were getting bearish, however as you may recall I posted two S&P 500 charts, which showed how important the 1540 support area was for the S&P.  Since that time the S&P 500 has rebounded 38 points off that level!  Therefore I hope some of you bears covered your shorts there and took profits because at the very least you can now start to scale back into your shorts at a much higher levels, 38 SPX points is tough to shit through!  This is why I pointed out that 1540 support area last Thursday.

The first chart shows the P&F chart which I showed on Thursday, clearly that 1540 was big support, now however keep an eye on the 1580 area.  The second chart shows a daily candlestick chart, could today's move still be part of a RS to form a H&S pattern?  Perhaps, however as of yet we have yet to see any reversals, but you could look to scale into some lower risk shorts (38 points higher up here) with a tight stop, or you can wait for a reversal trigger, your choice, however shorting up here is MUCH more objective than last week's oversold condition.

Otherwise we'll see what the market does here, it could also form a triangle and attempt to form one more high to trick both the 'bulls' and the 'bears' who are not expecting that, or form a flat, or top out in here in the upper 1570's, again let's see how it plays out

Monday, April 22, 2013

Educational Newsletter on Hidden Divergence


Over the weekend on Saturday we had a webinar for our futures academy students were we discussed divergence trading, we also discussed a concept called hidden or reverse divergence.  


Here's an educational newsletter I just made which discusses standard divergence, and especially hidden divergence.  Hidden or reverse Divergence is very useful at allowing you to play the trend (vs picking tops and bottoms


CLICK HERE - Educational Newsletter on Divergence


Sunday, April 21, 2013

Cost of Mining an ounce of gold - table of gold stocks

Hello Folks, here's a table that my wife (the Excel Goddess) created over the weekend with some data that we had, it shows the total costs to mine one ounce of gold for a select group of gold mining stocks.  We did not have the data for all the stocks, this is what we had. However this data can be quite useful as it shows you that fundamentally you should probably stay away from stocks like Iamgold, and focus on the metal stocks with lower costs.

I believe that gold stocks are due for a bounce here and if you want to know more, please subscribe to Breakpoint Trades and review my Wekend Commodity Newsletter for Sunday April 21st:

Here's a 20% Coupon off our 6 month membership! Enter the following coupon code when subscribing   705DD97275

Market follow up comments

In my post last week, I showed how important the 1540 ish are was on the S&P 500, and the S&P 500 clearly rebounded off that as well as the 50 day moving average. Early this I would love to see follow through to perhaps test the 20 MA or 9 EMA above, this would provide a lower risk short opportunity.  See the daily chart, a bounce and consolidation could form a small RS of a H&S top, which would portend to a nice sell in May event!


The second chart shows a 60 min chart, watch for the broken uptrend line of the channel to provide resistance.


The third chart shows a 15 min chart along with Fibonacci retracements.

Thursday, April 18, 2013

The S&P 500 is testing a major pivot

The market was down yet again today and slightly undercut the major support area at 1540, however closed back above it to close right on the 50 day MA.  This is major support, now the question is does the SPX bounce to form a lower high or RS of a H&S top (see the purple lines) if so that would be a fantastic low risk short into a Sell In May and ago away event, or does it simply lose support here?  We'll see. 


The second chart also shows a point and figure chart, which demonstrates how important this 1540 area is.


Wednesday, April 17, 2013

GDX RSI 2 oversold Statistics


Today the 2 length RSI closed at 0.87% and I decided to test
conditions where one goes long when RSI 2 closes below 1%, and exit when
price closes back above 80%


**CLICK HERE**to view the Newsletter


Copper and the market

If you've been following my analysis/newsletters, you are well aware that copper broke down from my week triangle pattern about 5 weeks ago and continues to weaken


However the second chart show an overlay chart of Copper (in red) and the S&P 500 (in black).  As you can see the two have generally followed each other well over the years, however this huge divergence between the two that has been developing for the last 3 months most likely portends to more downside in the S&P 500 and general market over time.

Intra day market video market update and a look at the charts

Click here to watch the 3 min video

regardless if we get a bounce or not to form a RS or a lower high as I show on the daily and 60 min charts, I do think over time the market will work its way lower and eventually use that 1540 support and work low 1500's

Market Comments

As you know the market reversed yesterday's gains, the first chart shows a 60 min chart, that uptrend line is first support, however losing that and the 1552 would send price down to the next pivot support at 1540 and that's SUPER important support.


The next two charts are daily S&P 500 charts, clearly the 1540 is a very important level, however over time a test of at least the 50 day moving average below seems logical.  Also if a Head of a Head & Shoulders pattern was put in place, we could be looking at leg down to 1500 eventually. 

Tuesday, April 16, 2013

ABX gold stock comments


Man ABX looks like Niagara Falls, well this slope can't last forever and will eventually get some kind of snap-back rally/bounce like a rubber band that is stretched too far, but for now jeez...

The 60 min chart doesn't have any divergence, however I can draw a nice downtrend line on the ABX/GLD ratio. As you can see trendline breaks of the ratio on both the daily and 60 min chart work quite well for catching nice moves.

VIX going to close inside it\'s Bollinger Bands

could provide more market upside

Nice oversold bounce - comments

As you know the market has a big sell off yesterday, today however it is up nicely, the S&P 500 is up nearly 20 points.  However as I pointed out in the newsletter, the market was very oversold yesterday and closed at support, as you can see via this daily SPY chart, it bounced off the uptrend line. 


This is why unless you were already short coming into yesterday or you shorted yesterday morning, we advised our members to NOT CHASE shorts late in the day or at the close yesterday because the market was so oversold and at support - today you can see why.  


I still favor this market bounce forming a lower high and then having another decline to take out yesterday's lows, however now you can look to establish much more objective shorts at higher prices.  

Monday, April 15, 2013

Important Newsletter Update for Monday April 15th, 2013

As you know, the market got clobbered today, here's my comprehensive newsletter covering today's market move, where I think it's going, various indicators, commodities and especially precious metals, and trade ideas.


**Click Here** To View the Newsletter

Our Thoughts and Prayers are with the People Affected by this Tragedy in Boston


Today was a rough day on the market as well as a rough day nationally.

While we will have our thoughts about the market later in the evening we would just like to take a moment and acknowledge the horror in Boston today.

Our hearts and prayers go out to anyone personally affected or still waiting to hear from loved ones.

S&P 500 monthly chart - perfect kiss and rejection

I posted this monthly chart last week - as you can see, a perfect back test of that upper resistance trendline and rejection!  


I love it when a plan comes together!!

Here's a video update on GDX, as I showed earlier ...

Here's a video update on GDX, as I showed earlier today the bear flag target was met, also one thing I look for is on the lower trendline, watching for a false break of the lower trendline and then close back above.  If GDX can close above the open candle today, that would be positive for the short term


CLICK HERE to watch the video regarding the daily chart

GDX daily Renko system chart

I haven't shown this for a while, here's my daily GDX Renko system chart, as you can see it has caught most of this large sell off in GDX over the past few months, besides some small whipsaw trades last fall, it has caught most of the move.  That's who these type of systems work, they are not perfect, they tend to catch large moves because they follow price, but can give whipsaw trades as well - it's best used as a guide along with your standard charts.

Comments on Gold


Crazy day for gold so far, it was down -$140 a few moments ago!


Here's two charts of interest: However please note that these don't reflect today's moves yet as they do not until until this evening at Stockcharts.


The first chart shows a daily chart of gold showing a measured move projection based on the height of the rectangle pattern


The second chart shows my monthly chart, note that the 38% Fibonacci rectracement of the entire move from the 2001 lows to the 2011 highs roughly matches the rectangle projection.


The third chart shows Fibonacci retracments taken from the 2008 lows, the 50% Fib is at 1300

GDX and the gold market

The gold market continues to puke hard with Gold now down over -100 and silver has lost ledge support and GDX down -$2.75!  Again as I said last night, the thing to watch for now is some kind of capitulation and washout that perhaps where price is way down in the morning like it is now, but then mostly comes back by the close in order to form a hammer or doji reversal candlestick.  Otherwise at the moment it's ugly. Here's an updated daily chart, the bear flag measurement was just hit now, of course there are lower targets as well should price continue to fall - I discussed these last night.

Sunday, April 14, 2013

In-depth look at gold stocks

Also as promised here's an in-depth look at precious metal stocks. 


CLICK HERE to view the newsletter

General Market Weekend Newsletter

Here's our General Market weekend newsletter with our thoughts on the market


CLICK HERE to view the newsletter

Friday, April 12, 2013

Precious metals market

Gold continues to get pummeled and the selling has really intensified today, Silver as well.  However I will post my thoughts over the weekend, unfortunately $gold and $silver commodity charts from Stockcharts.com do no update until a couple hrs after the close.  


Also gold stocks continue to get killed, have you guys learned yet not to try and catch falling knives!!  Perhaps we are finally seeing capitulation here, however honestly for me to be interested in taking a position, I would like to see some kind of big washout intra day that recovers and ends with a big high volume hammer candlestick.  Or at least a good reversal on the daily chart that takes out the 9 EMA and follows though, even though, the much lower risk trade is to let the bottom pass you by in your rear view mirror and you establish a swing trade on the next higher low

Thursday, April 11, 2013

TSO

With the market strength as of late, there are not a lot of objective short ideas, unless you trying to pick tops in the market.


Here's a stock that is weak despite the move in the market, it displays a textbook Head & Shoulders pattern

S&P 500 monthly Big Picture and Video Discuss

Please watch this video that I made on the following monthly chart of the S&P 500.  In the video I discuss what I think the market will do this year and longer term, and also discuss the overall topping process and now markets behave


*CLICK HERE* to watch the video

A look at Japan's Nikkei Stock Index short term and big picture

I've been actively following the Japanese Nikkei for 15 years now, let's take a look at the recent action as well as the long term big picture, I've attached 3 charts 2 daily charts and a 31 year chart.


The first chart below shows a daily chart of the Nikkei, notice that it has enjoyed a monster rally from the Oct lows of 2012.  However take a look at the Japanese YEN, currencey plotted above, notice that it's had about a 30% decline since that time!  So clearly that has benefited their stock index a lot, also Japan is printing an insane amount of money/liquidity into their economy (a much larger percentabe wise than our US Fed is printing with it's QE), so obviously that money has to go somewhere and it's went into their stock market


The second chart shows the ETF, EWJ.


The third chart shows a monthly chart of the Nikkei going back to 1981, as you know the Nikkei has been in a secular bear market since late 1989. It has enjoyed a nice rally since the 2009 lows and recently but it's still below the long term downtrend line.  This chart shows you the power of deflation! We'll continue to keep an eye an eye on this.

Wednesday, April 10, 2013

GDX, gold stocks and precious metals


Another horrid day for the precious metals market, Gold metal down -$25, however gold stocks got crushed again and gave back all their gains from yesterday!


Here's two charts of GDX, the gold miners ETF.


The first chart is one that we made last week that shows GDX in a major downtrend and is either in the process of forming a head of an inverse H&S pattern or a bull wedge that has more downside.  Needless today, this sector has a lot of work to do. A lot of gold bugs have been capitulating lately, so perhaps that is the beginning of a bottom process , but otherwise this sector has been a disaster.  


The second chart shows a a second daily chart of GDX using a simple system of a confirmed cross over of 50% for the Williams % indicator, it has caught this entire move down and has never once got caught going long in this downtrend from Sept last year.


Otherwise in the short term GDX has a another bear flag look to it, thus I wouldn't be surprised to see anther flush down again.  We probably need another good washout in this sector in order to get the remaning gold bugs to throw in the towel, which would market a bottom.


SPX monthly nearing the upper trendline

Here's a monthly chart of the S&P 500, with this last advance, it's nearing the upper trendline, which goes back to the early 2000 highs, perhaps that needs to be tagged, again like an itch that needs to be scratched. 

Market at new highs, comments


The S&P 500 wanted that all time high, kinda like an itch that needed to be scratched, it was just too damn close!  Plus this next push is logical because it causes the most pain for both the 'Bears' who keep trying to pick tops, but also for a lot of the 'masses' who thought some sort of correction had started last week and either sold or shorted and are getting burned as well.  Over the years I've found that the  market generally does what will fool the masses.  For example, if too many peole see a pattern, many times that pattern won't play out.


Otherwise short term let's see how far this 5th wave takes us.  In last night's newsletter Steve discusses his thoughts for high how this can extend. 


Also those NAMO and NYMO bollinger band charts once again clearly called last week's bottom, those have been amazing at picking tradeable bottoms